Case studies
Six systems, shown at the stage they are actually at.
These are the systems Elion has designed and built. Each is presented with real captures, its genuine stage, and the disclosure that says exactly what you are looking at — including the ones that are still prototypes.
How to read this page
What we will and won't claim on it.
Most case-study pages exist to make a vendor look good. This one exists so you can judge what has actually been built — which only works if the rules are stated up front.
Every screen is a real capture
Nothing on this page is a mockup, a redrawn dashboard or invented window chrome. Where a system has no representative capture, it says so rather than borrowing another system's screen.
Every capture carries its stage
Production, deployment, active development, demonstration or prototype — the label travels with the image, and a demonstration is never presented as a running deployment.
Every capture is privacy-reviewed
Redactions are stated in the disclosure beneath each image. No redaction applied during review has been reversed to make a screen look better.
No results are claimed
You will not find a percentage saved, an hours-reclaimed figure or a customer quotation here. None has been measured and published, so none appears.
Shoyuzuke
A complete commerce operation: the storefront customers order through, a cryptocurrency payment path, and a members club — all on one operational record.
The operational problem
A growing food business selling directly to customers needs ordering, payment, fulfilment, stock and repeat-customer relationships to be one system, not four accounts that have to be reconciled by hand every morning.
What the system does
- Daily operating dashboard: orders and net sales for the day, what needs attention, and what stock is short.
- A USDT payment path that pins one network, one exact amount and one address, with the transaction signature checked by a person before an order is marked paid.
- A members club with accounts, saved details and addresses, order history and free membership — live for customers today.
- Inventory watch and a recent-orders view sitting on the same record the storefront writes to.
How to read this evidence The Crypto POS and Members Club captures come from the shipped production build running on an isolated verification deployment — identical code, separate database — so no live customer, order or wallet appears.
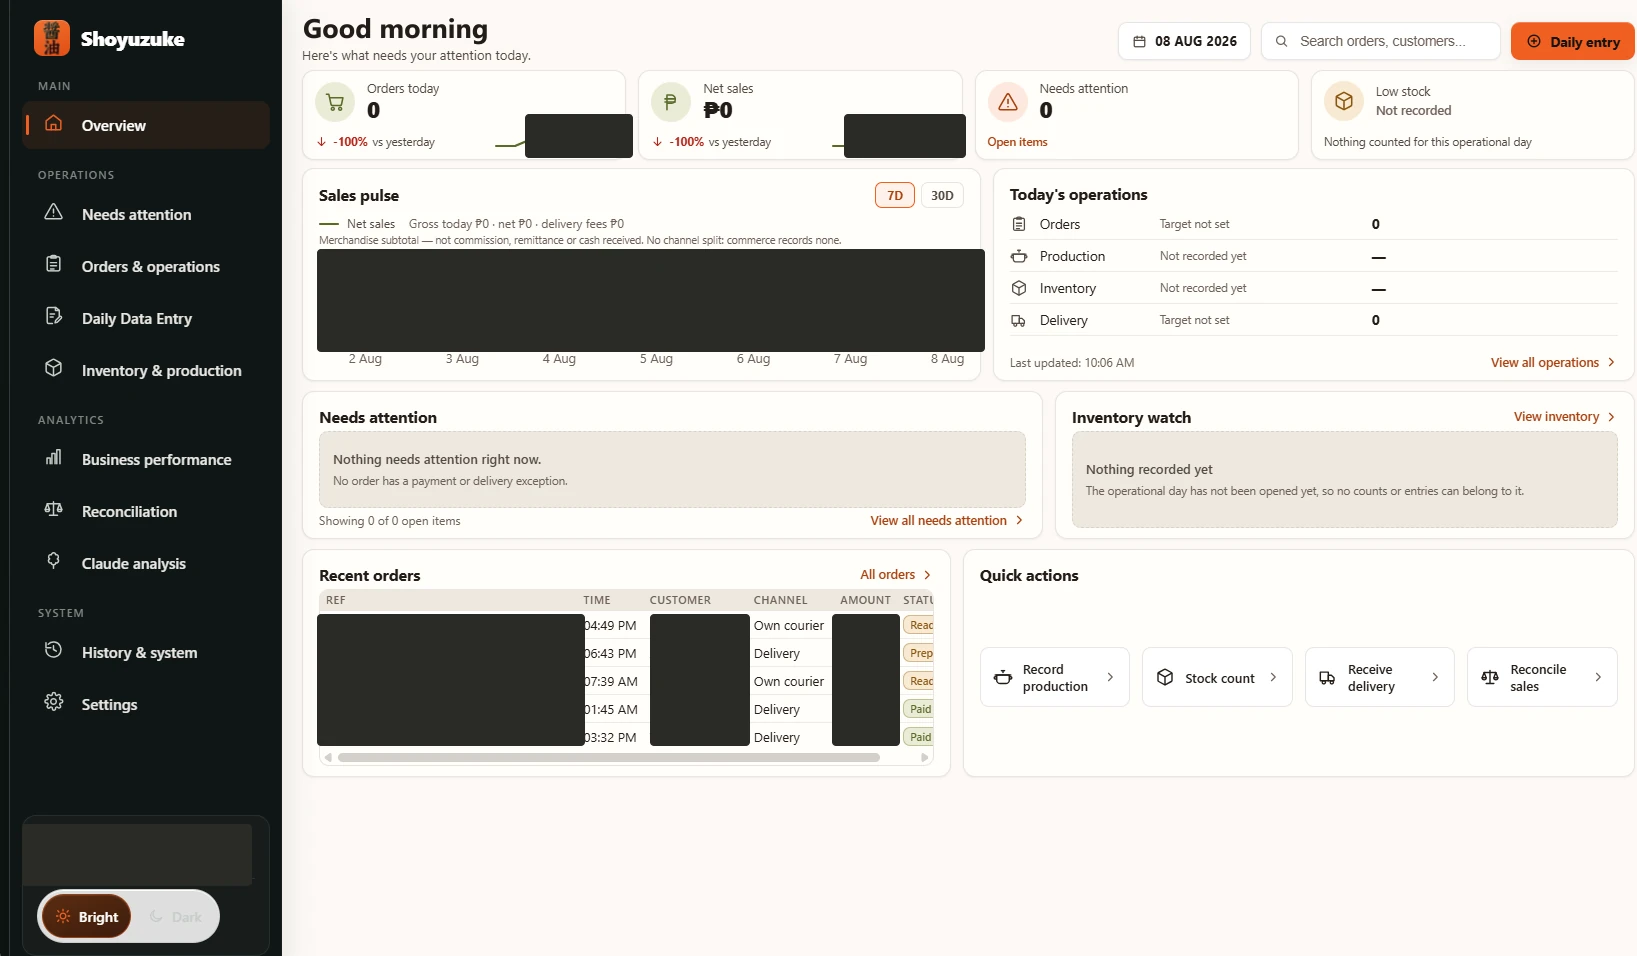
What the owner opens each morning: today's operations, what needs attention, and what stock is short.
Real production data captured on a day with no orders yet. Order references, customer names, exact amounts and both trend charts are pixel-redacted.
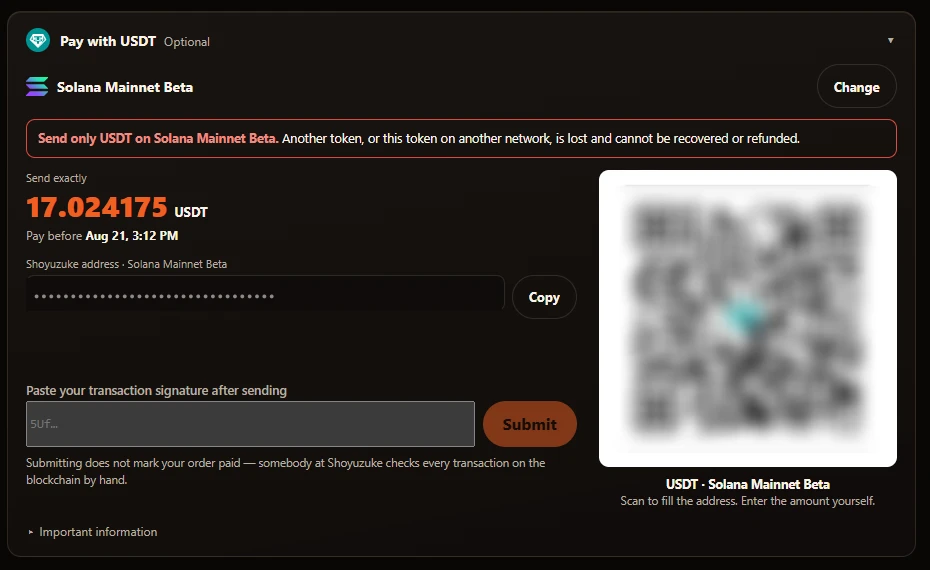
The real USDT payment step: one network, one exact amount, one address — and a signature the shop checks by hand before the order is ever marked paid.
Production interface, captured on an isolated verification deployment. The receiving address and its payment QR are masked, and the order amount belongs to a verification order — never a customer's.
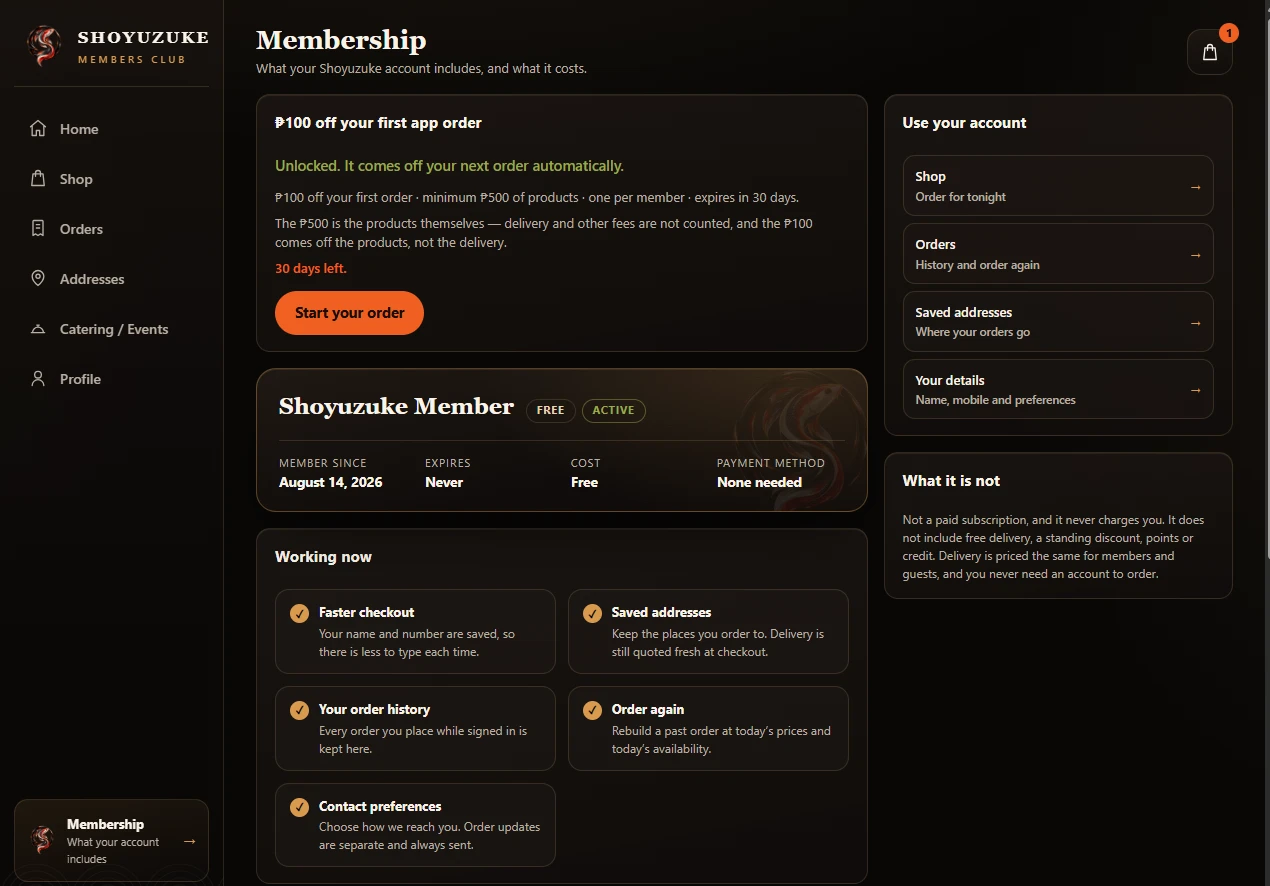
The members dashboard as a member sees it: membership state, what the account gives them today, and the account actions behind it.
Production interface, captured on an isolated verification deployment with a demonstration member account. No real member, contact detail or order appears.
Read more about the underlying capability: Commerce
TNG ERP
The operational core behind a group of businesses: purchasing, approvals, inventory integrity, receiving, and the management view above all of it.
The operational problem
A group running several businesses had purchasing decisions, budget authority and stock movement spread across people, spreadsheets and conversations — with the unexplained gap between expected and actual stock usage only surfacing at the next full count.
What the system does
- Twelve live operational counters and the budget review queue behind them on one management screen.
- Every purchase requisition on one board, in whichever of eight approval stages it has actually reached.
- Expected against actual stock usage compared daily, so an unexplained variance surfaces the same day rather than weeks later.
- Delivery documents read by AI and reviewed by a person before anything is applied to stock.
How to read this evidence Production data. Account-holder and requester names were redacted before publication; the integrity monitor was captured on a clean day, at 0.0% variance with no flagged items.
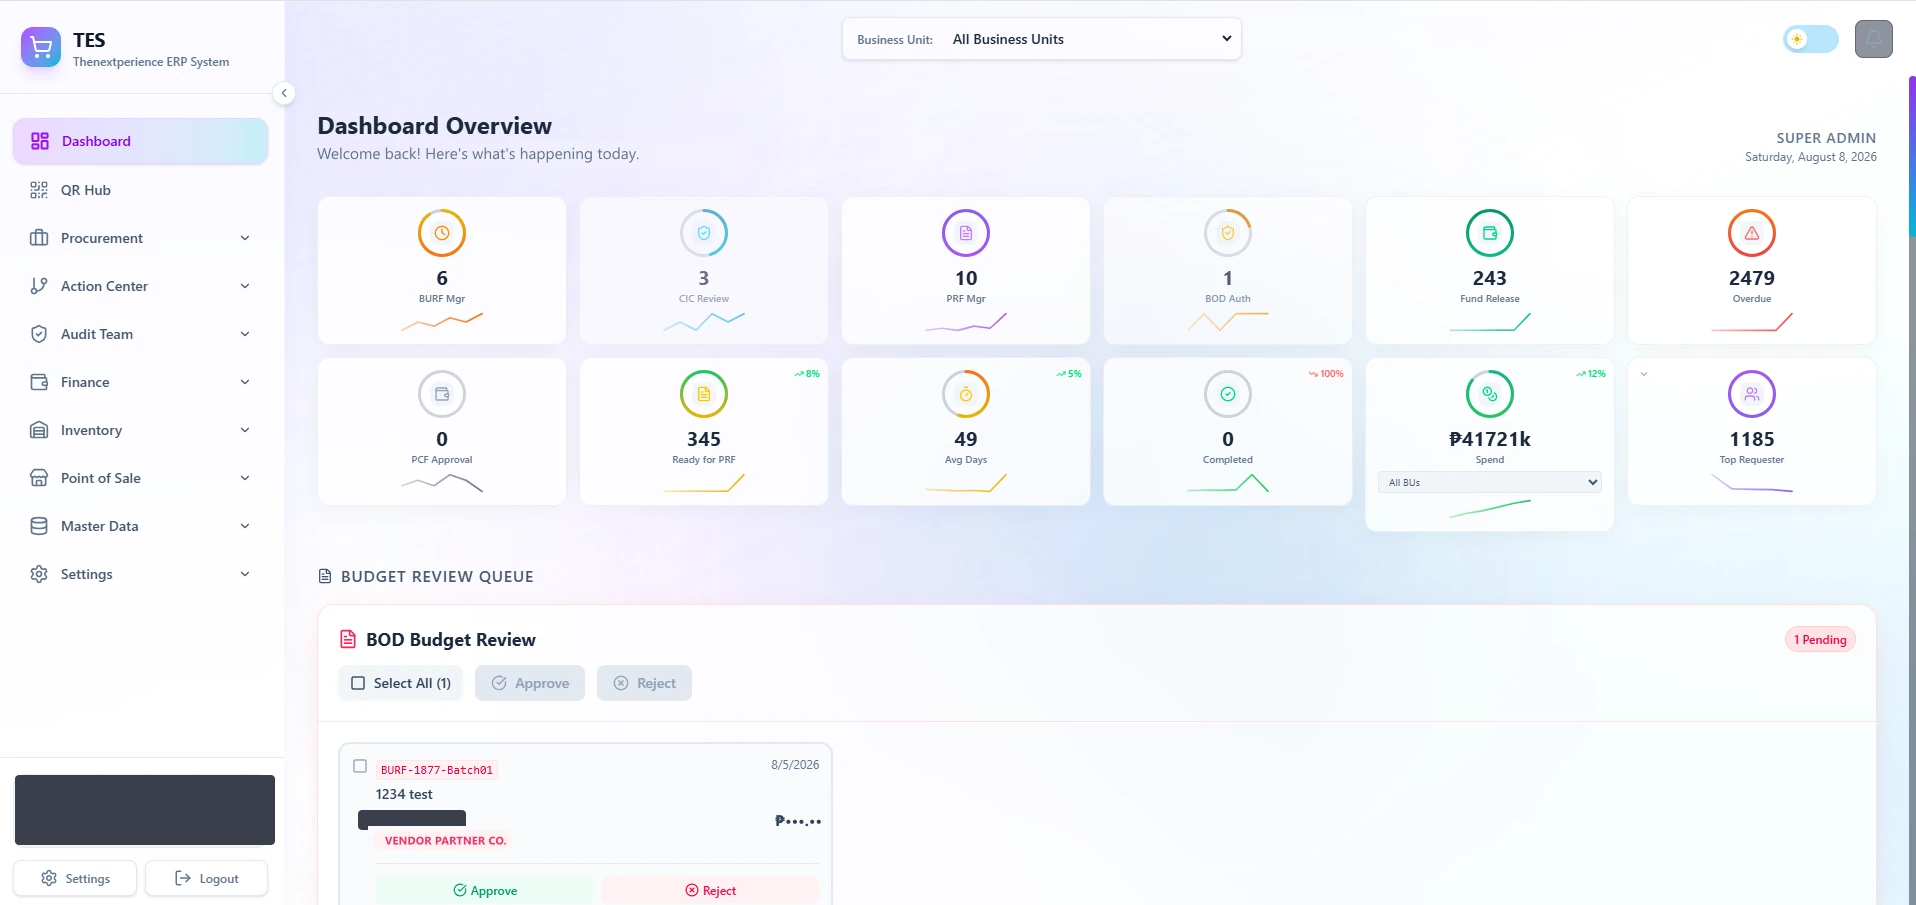
The management dashboard: twelve operational counters and the live budget review queue behind them, on one screen.
Real production data. Account-holder and requester names redacted before publication.
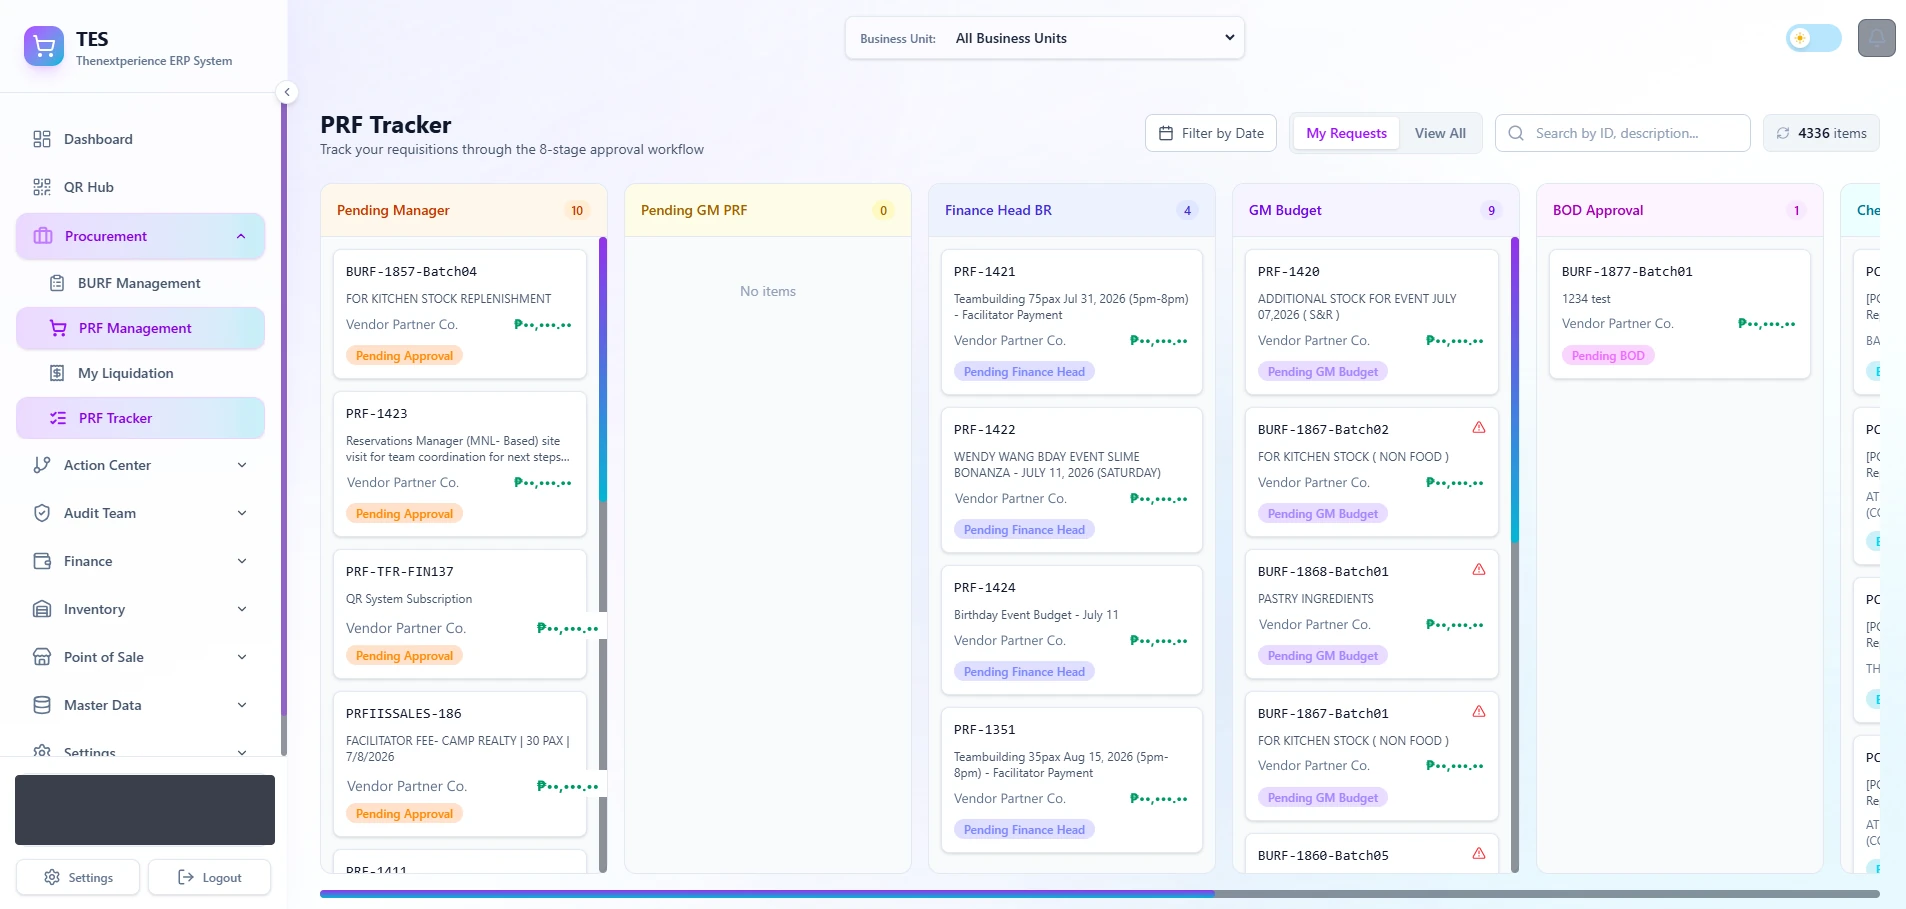
Every purchase requisition on one board, in whichever of the eight approval stages it has actually reached.
Real production data. Account-holder chip redacted before publication.
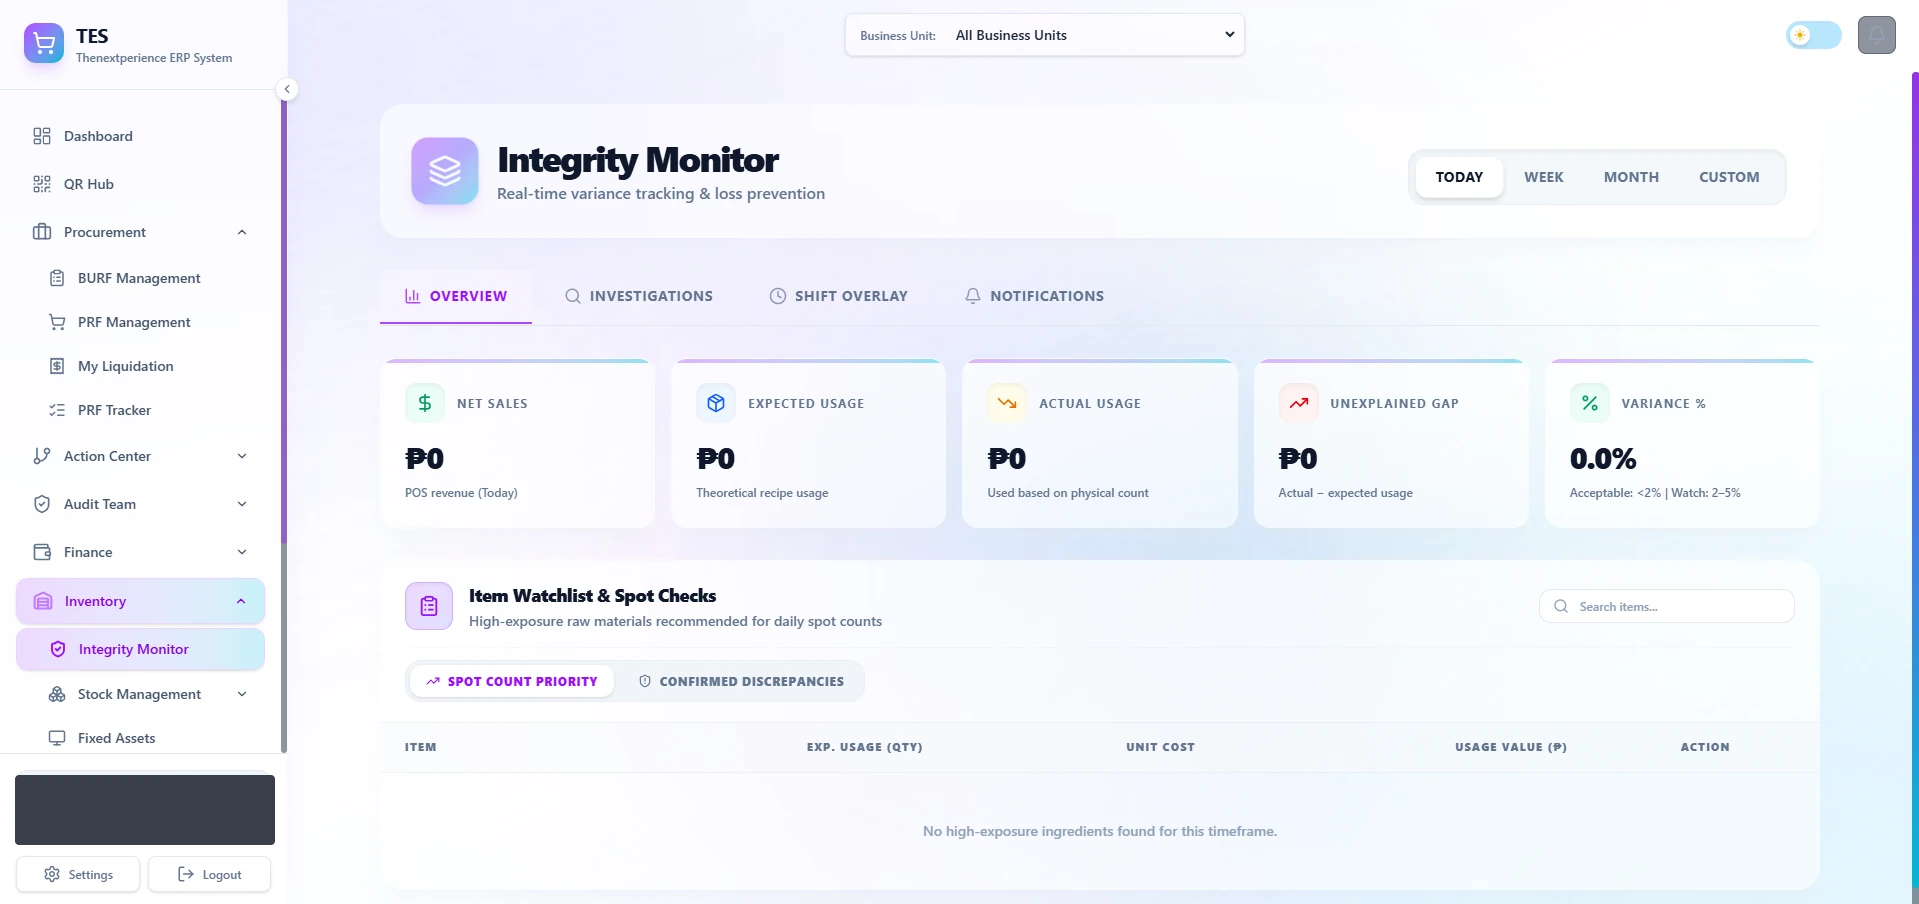
Expected usage against actual usage, with the unexplained gap calculated daily instead of discovered at the next stock count.
Real production data from a clean day — 0.0% variance, no flagged items. Account-holder chip redacted.
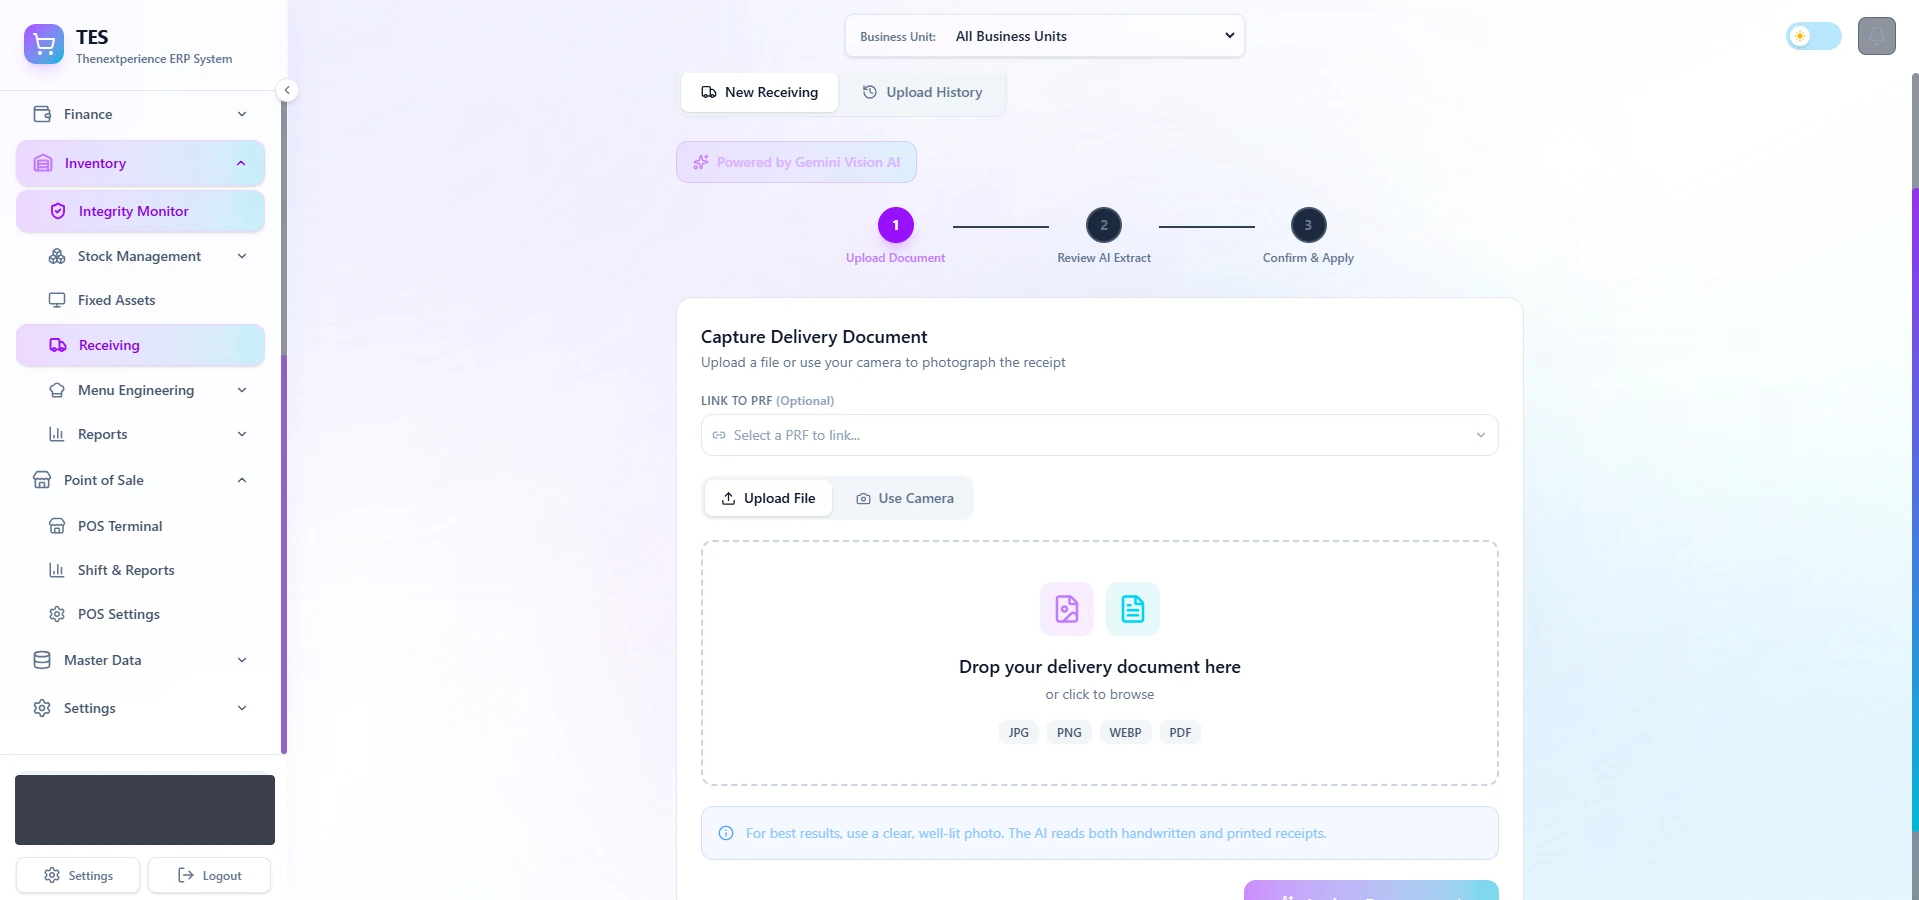
Delivery documents read by AI, then reviewed by a person before anything is applied to stock.
Real production data, captured in the idle state — no document was uploaded during capture.
Read more about the underlying capability: Operations
TNG Workspace
The coordination layer above the operational systems: channels, structured reporting, and the automation rules that connect the ERP to the people who act on it.
The operational problem
Six businesses under one group were coordinating in scattered chats, so an incident could arrive incomplete, an approval could be untraceable, and nobody had a single view of the whole group's people and channels.
What the system does
- Six businesses, their channels and their people under one shell — the operator's view of the whole group.
- A critical-issues channel with the incident reporting format pinned, so a report arrives complete the first time.
- Eight workflow automation templates covering ERP events, low inventory, new employees, overdue tasks, incident escalation, daily closing, complaint routing and campaign approval.
How to read this evidence Captured on a local demonstration with seeded accounts — no real employee data appears. Every automation rule shown is labelled DORMANT in the product itself: these rules are defined, not running in production.
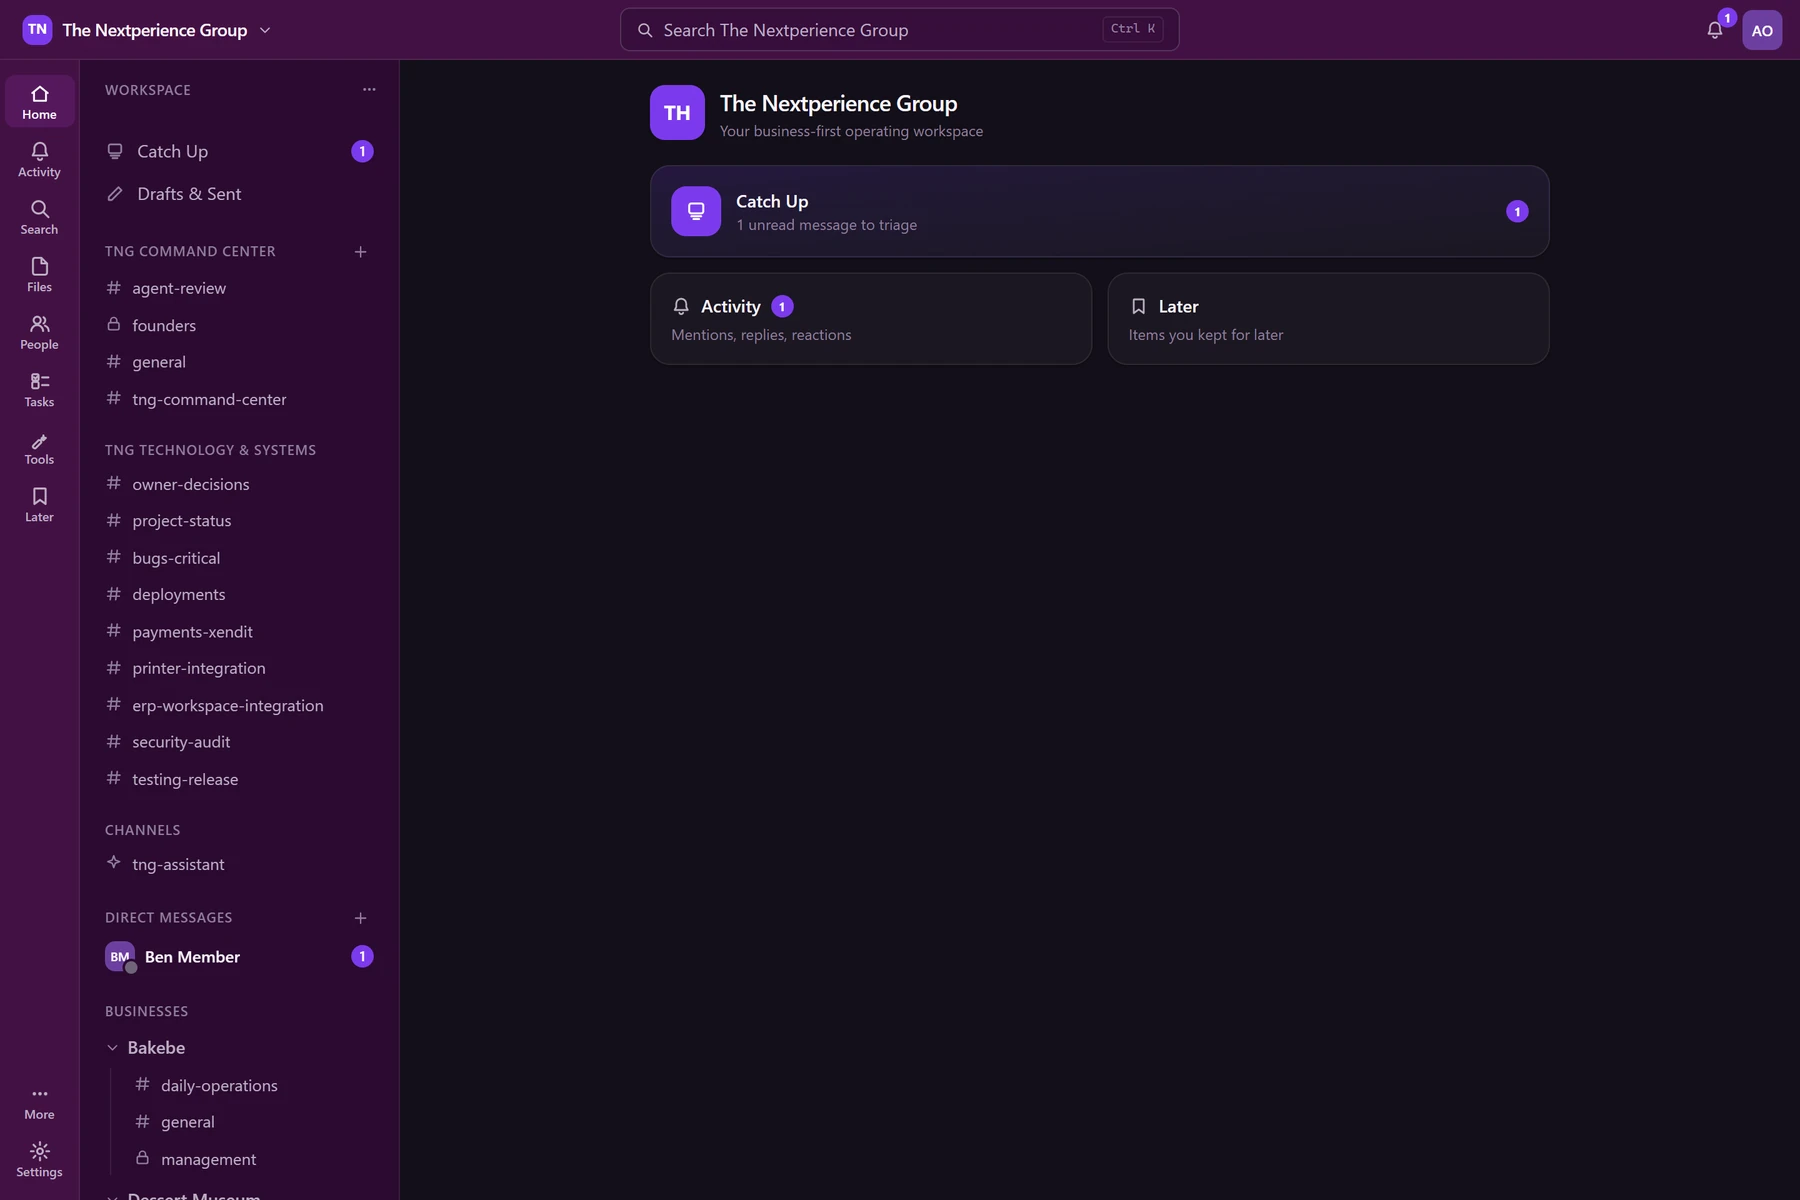
Six businesses, their channels, and their people under one shell — the operator's view of the whole group.
Local demonstration with seeded accounts. No real employee data is shown.
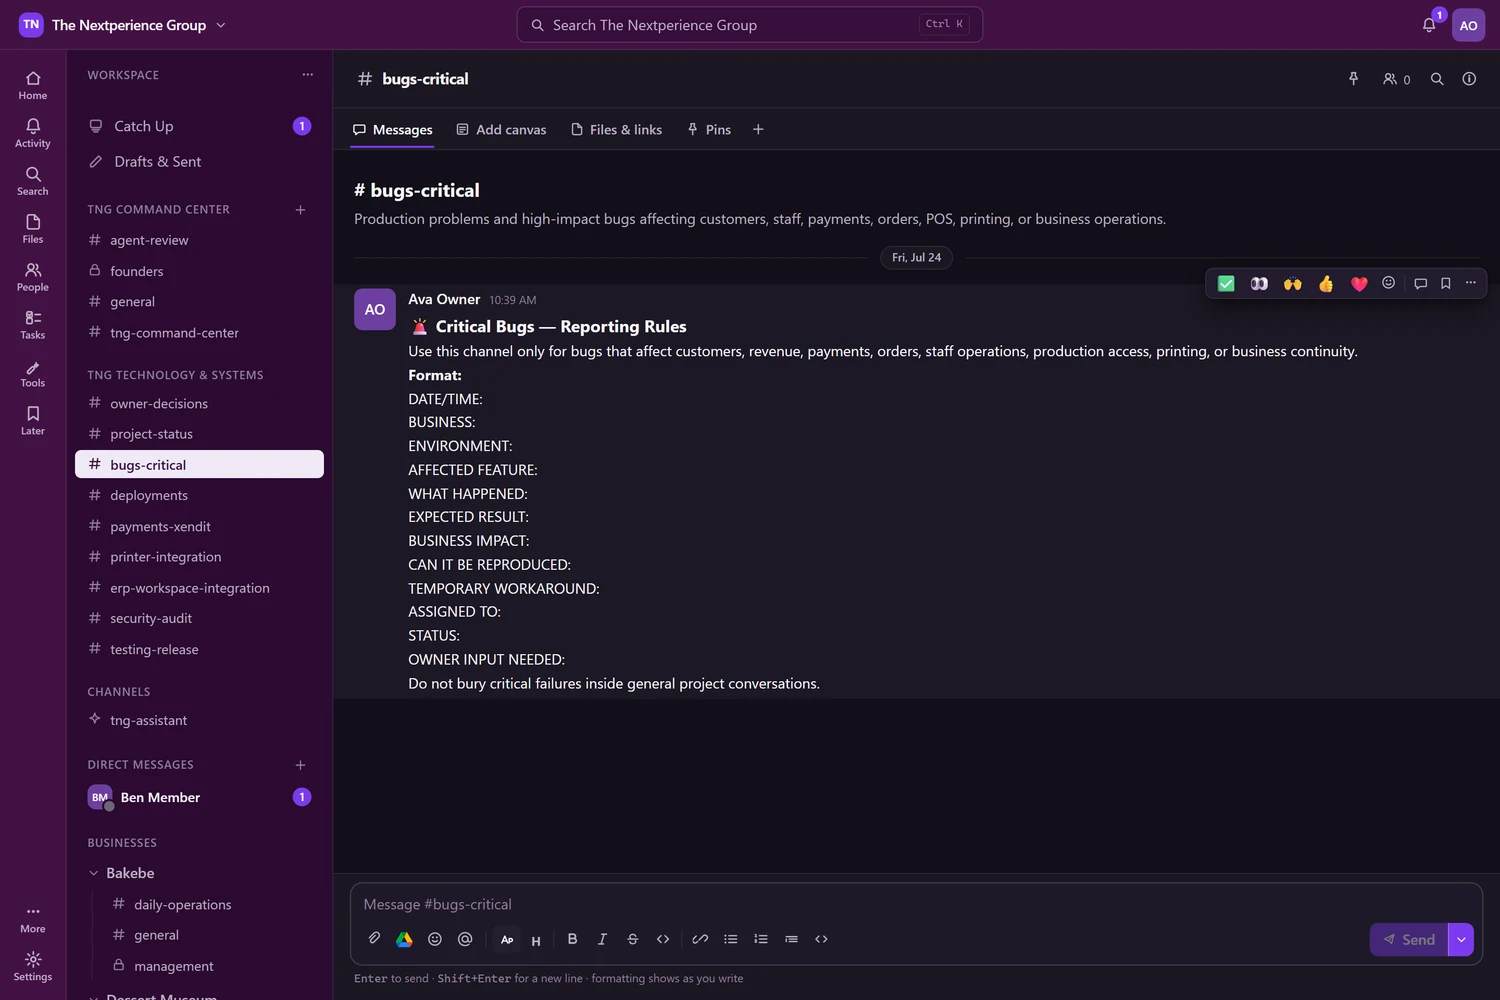
A critical-issues channel with the reporting format pinned, so an incident arrives complete the first time.
Local demonstration with seeded accounts. No real employee data is shown.
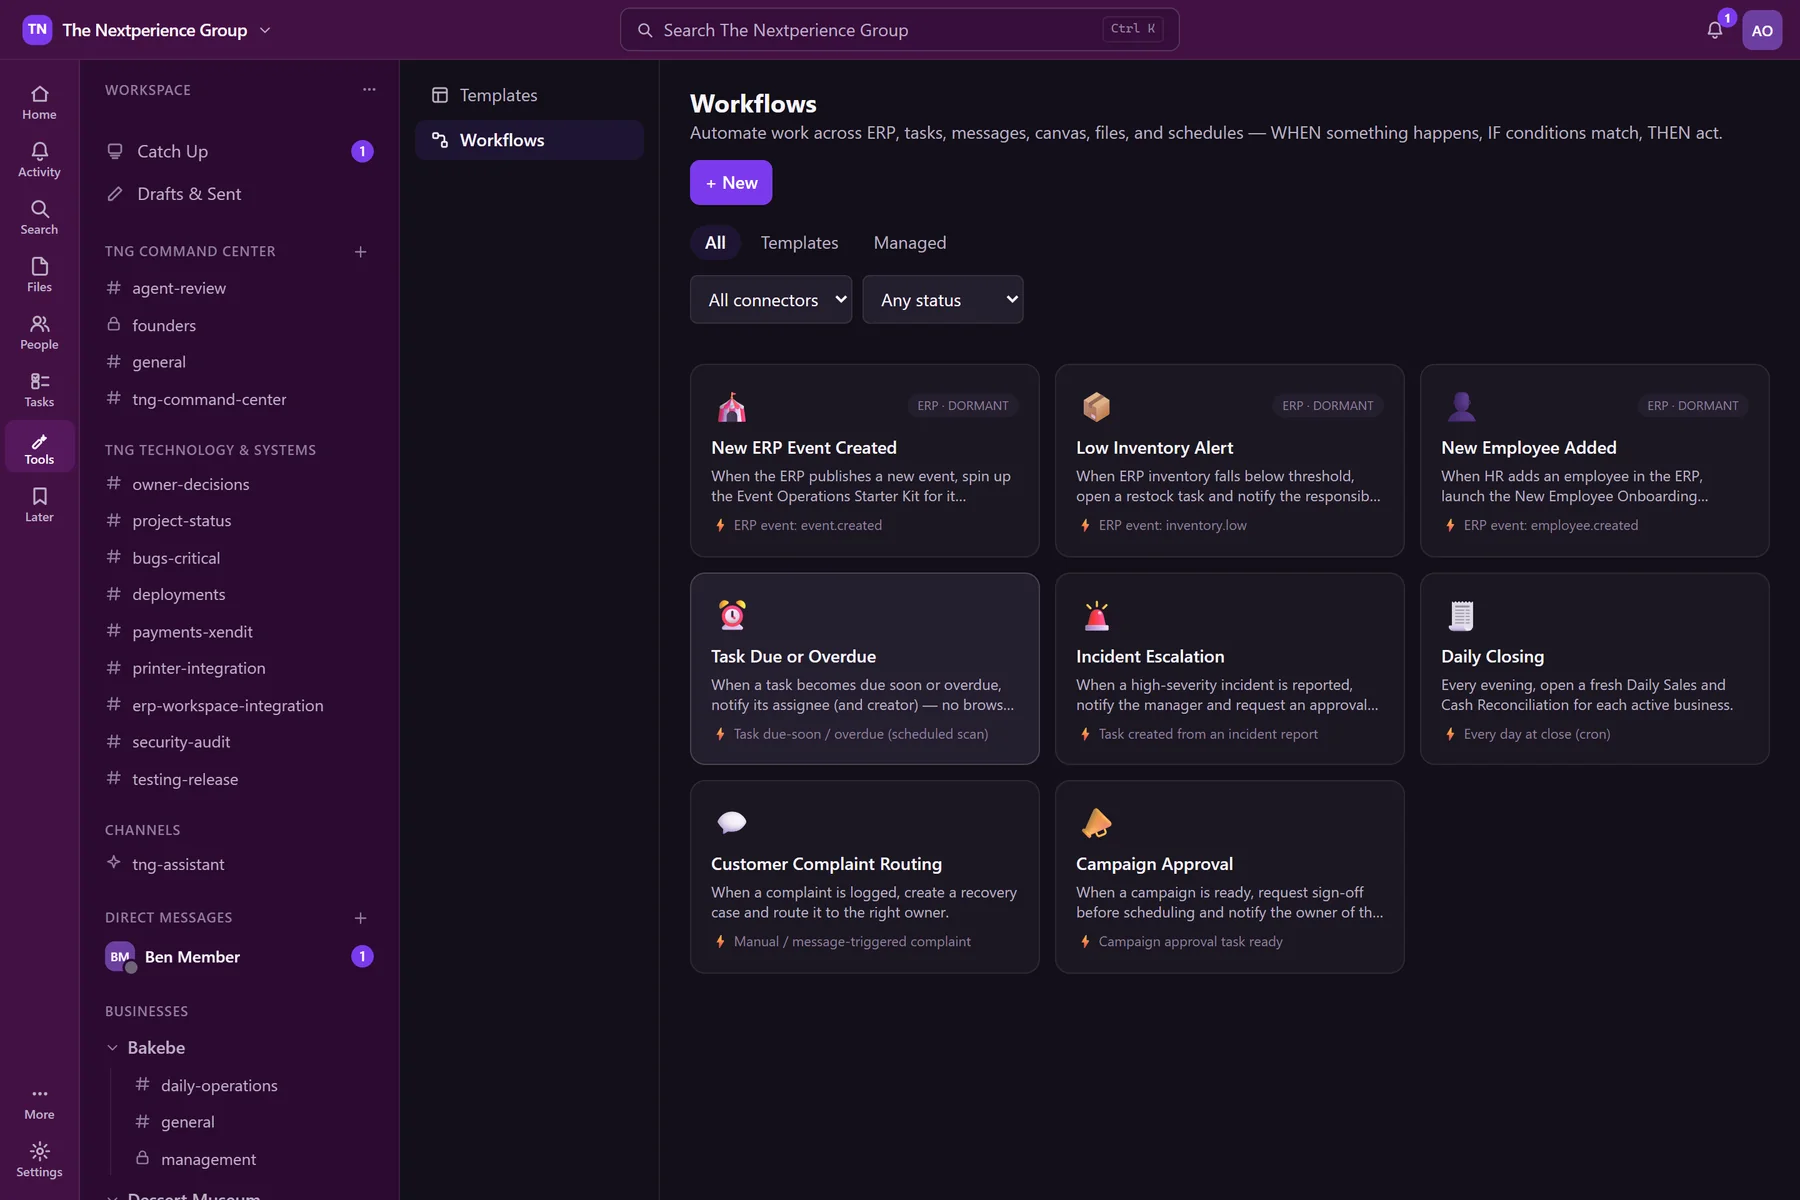
Rules that connect the ERP to the people who act on it: when something happens, if conditions match, then act.
Local demonstration with seeded accounts. Every automation shown is labelled DORMANT in the product — these rules are defined, not running in production.
Read more about the underlying capability: Workspace
The Fun Roof & venue QR ordering
One ordering engine serving multiple venues under each venue's own branding — from the guest's phone at the table through to the kitchen and bar boards.
The operational problem
A venue taking orders on paper loses the connection between what a guest asked for, what the kitchen is making, what the bar is pouring, and what the cashier eventually reconciles — so the same order gets written down three or four times.
What the system does
- A guest scans the table QR and gets that venue's own branded menu — the same engine, a different venue.
- The cart is the same order record the kitchen will later see, so quantities change there rather than on a paper chit.
- Checkout carries the order straight into payment via GCash, Maya, QRPH or card. Nothing is re-entered.
- Kitchen and bar run separate queue boards with their own timings, and a drink ticket says when the same table also has food in the kitchen.
- Cashier reconciliation compares paid against reconciled order by order, with the official invoice number recorded against each one.
How to read this evidence These are demonstration routes on a demo table, and the queue and reconciliation boards carry sample orders labelled DEMO in the product itself. No guest data and no real payment reference appears in any of them.
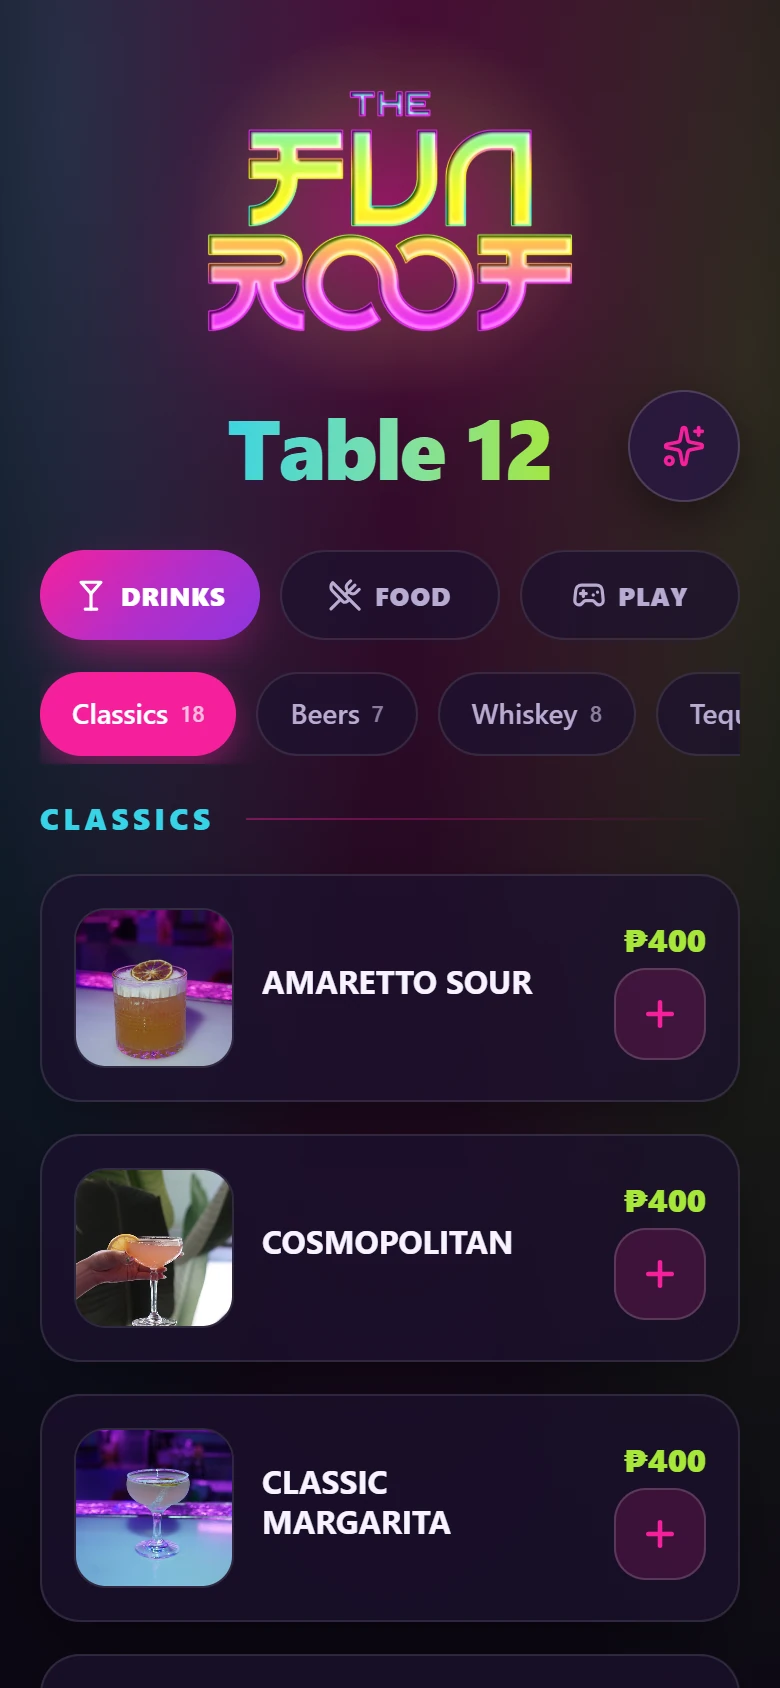
A guest scans the table QR and gets the venue's own branded menu — same ordering engine, different venue.
Demonstration route, demo table. No guest data appears.
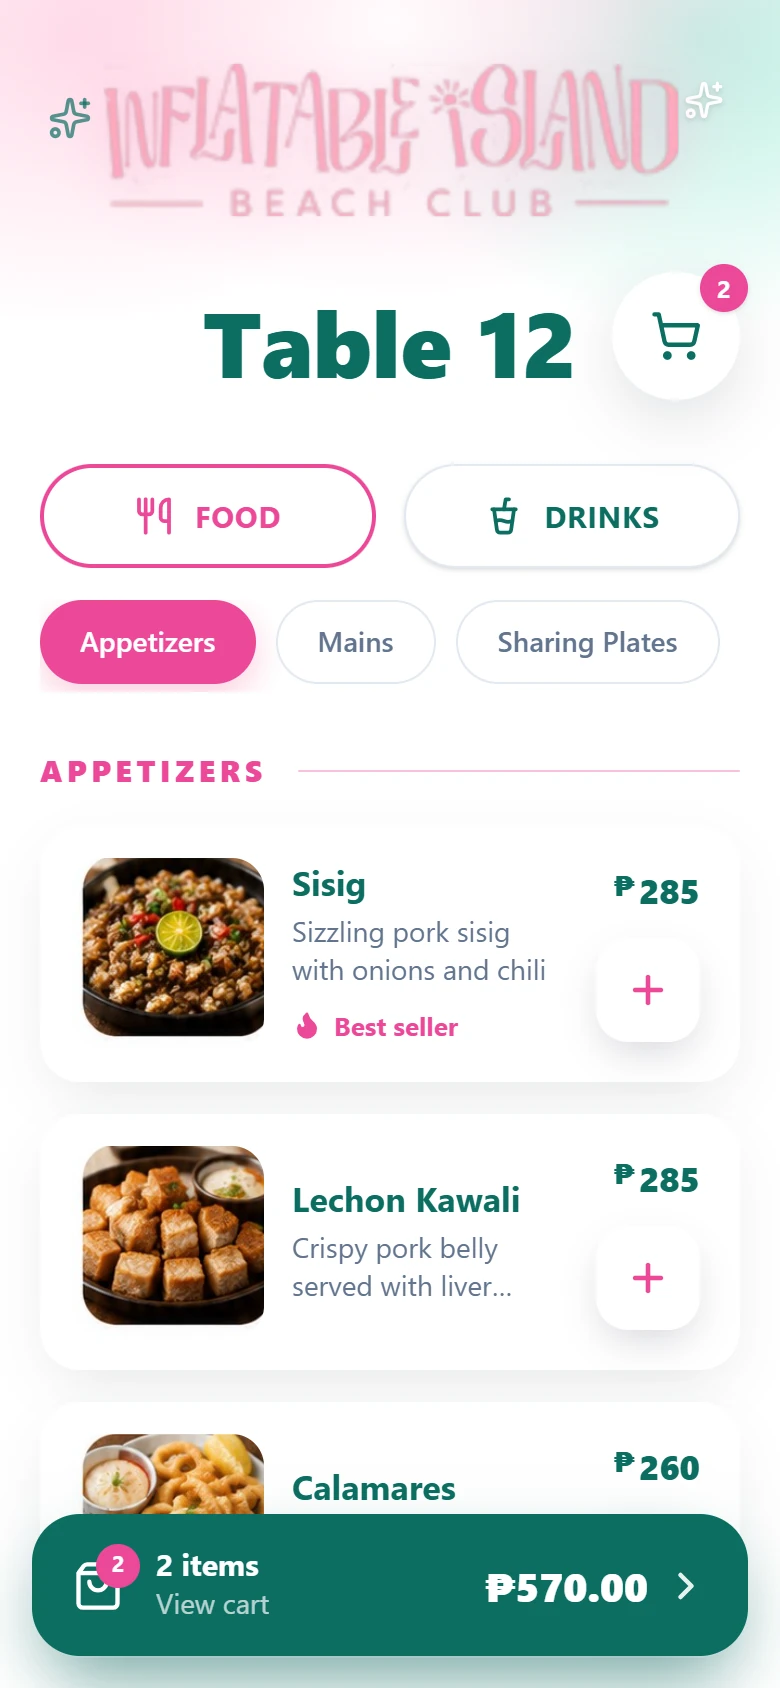
A guest scans the table QR and gets the venue's own branded menu — same ordering engine, different venue.
Demonstration route, demo table. No guest data appears.
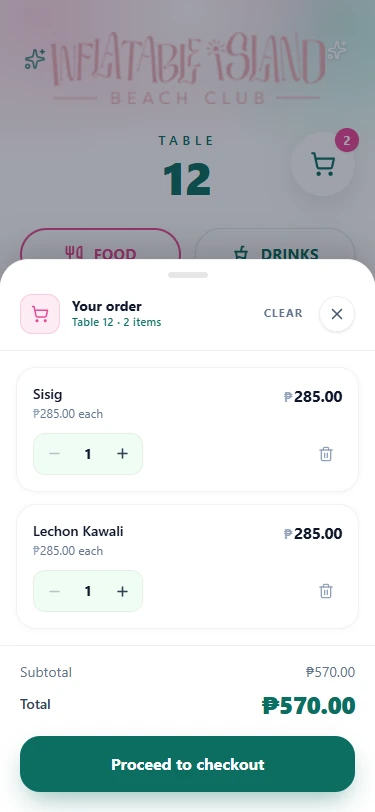
The cart is the same order record the kitchen will later see — quantities change here, not on a paper chit.
Demonstration route, demo table. No guest data appears.
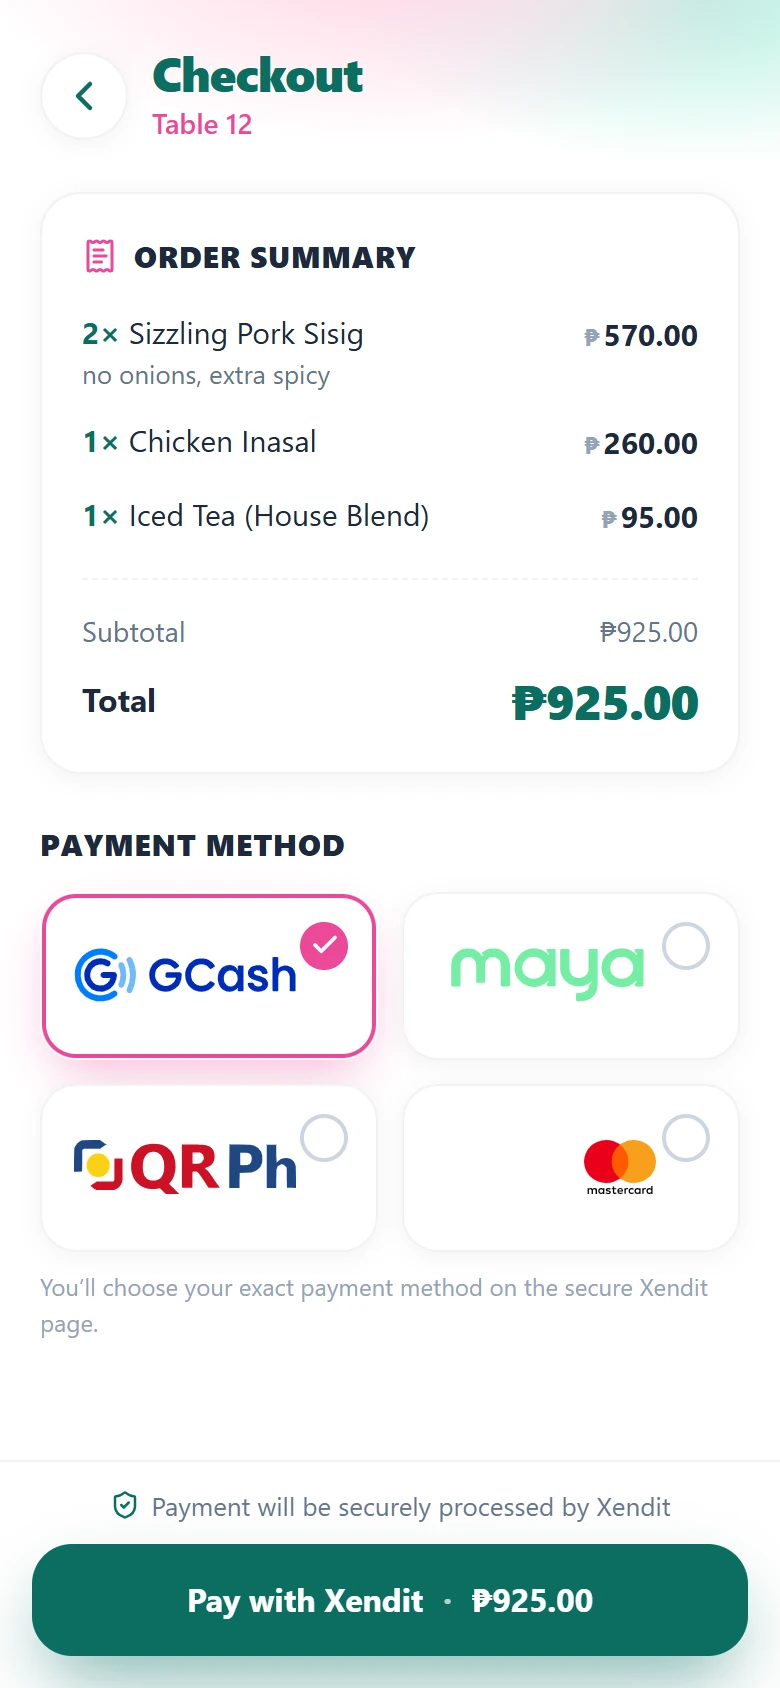
Checkout carries the same order straight into payment. Nothing is re-entered.
Demonstration route with a mock order. No real payment references.
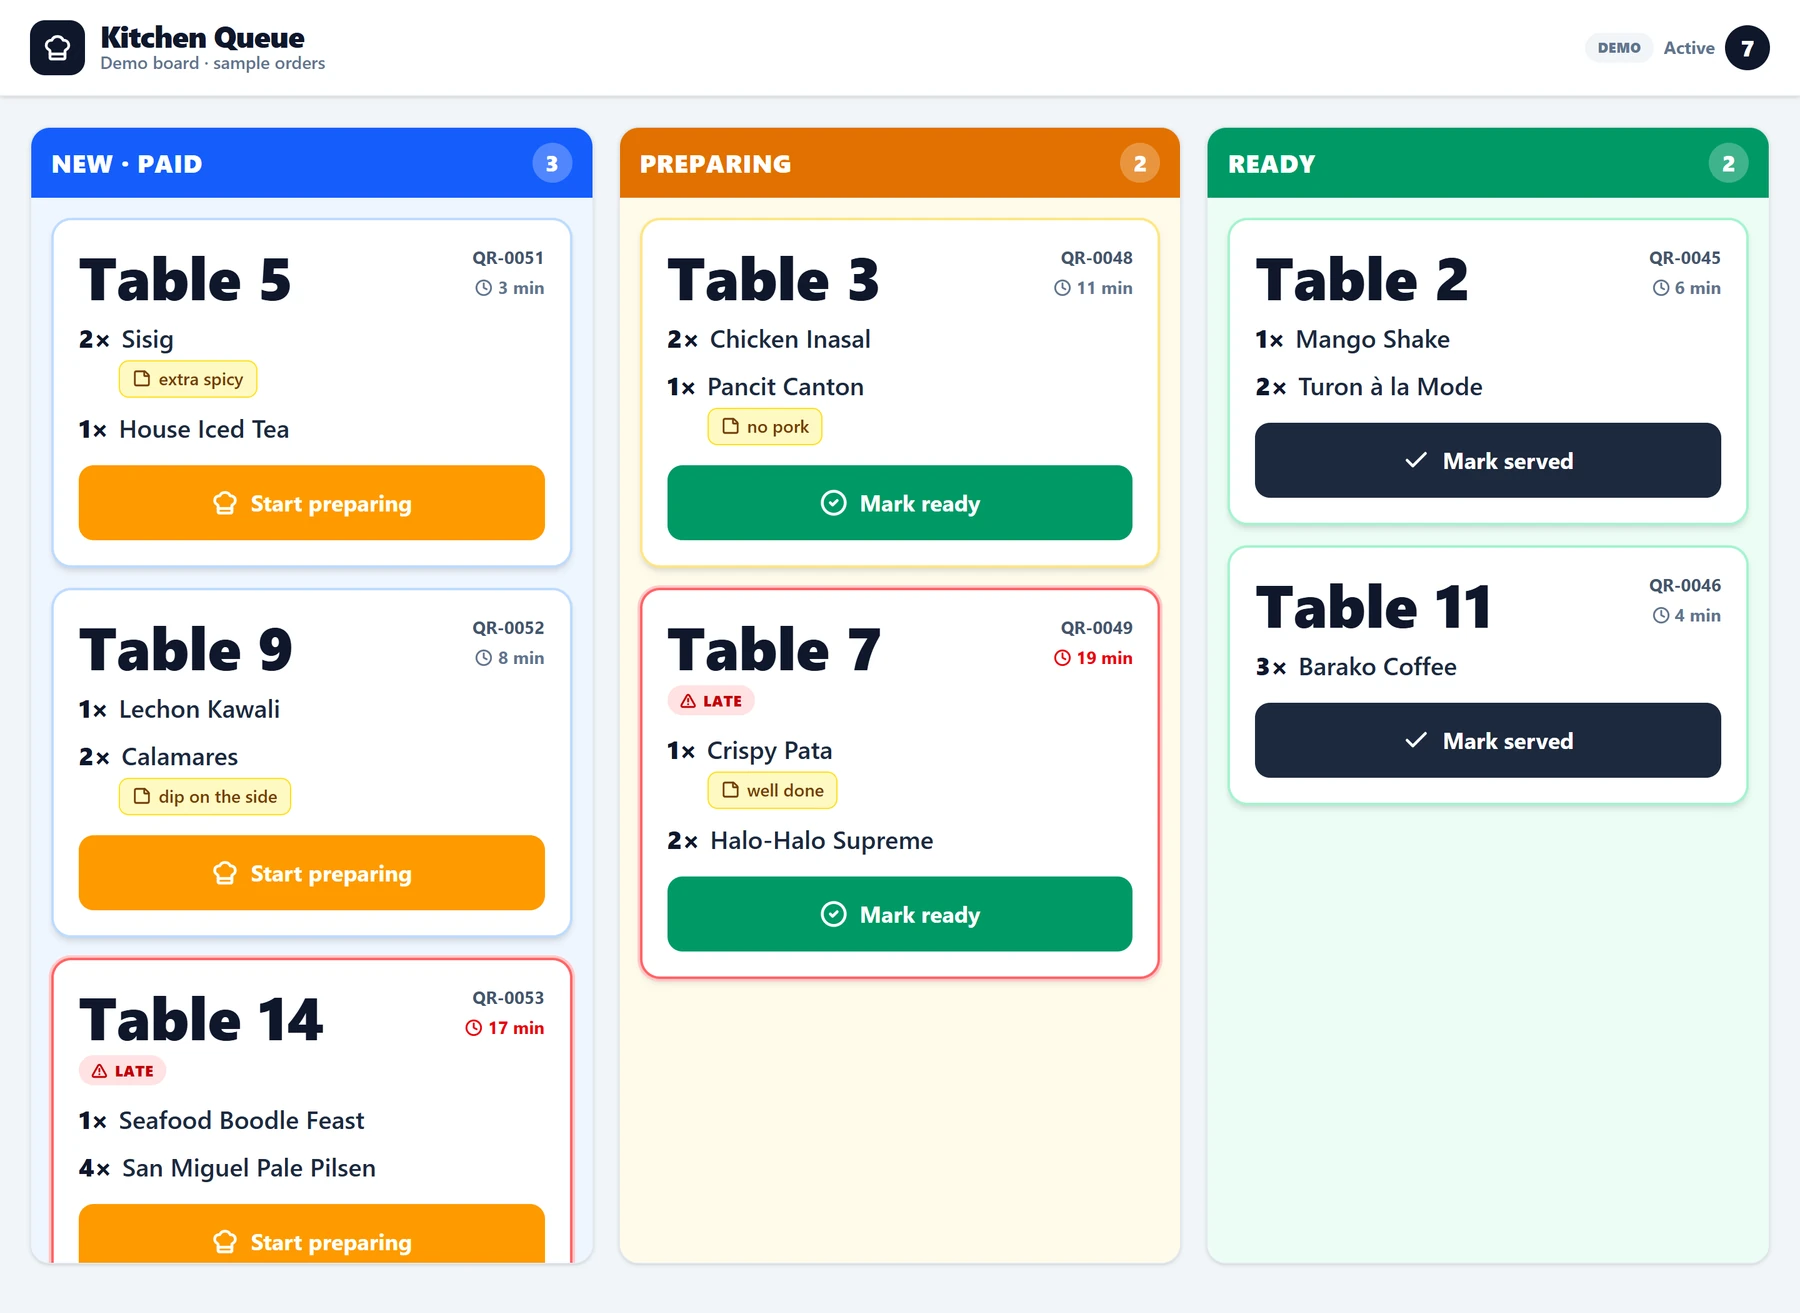
Tickets move new → preparing → ready, with elapsed time and late flags visible to everyone on the line.
Demonstration board with sample orders, labelled DEMO in the product itself.
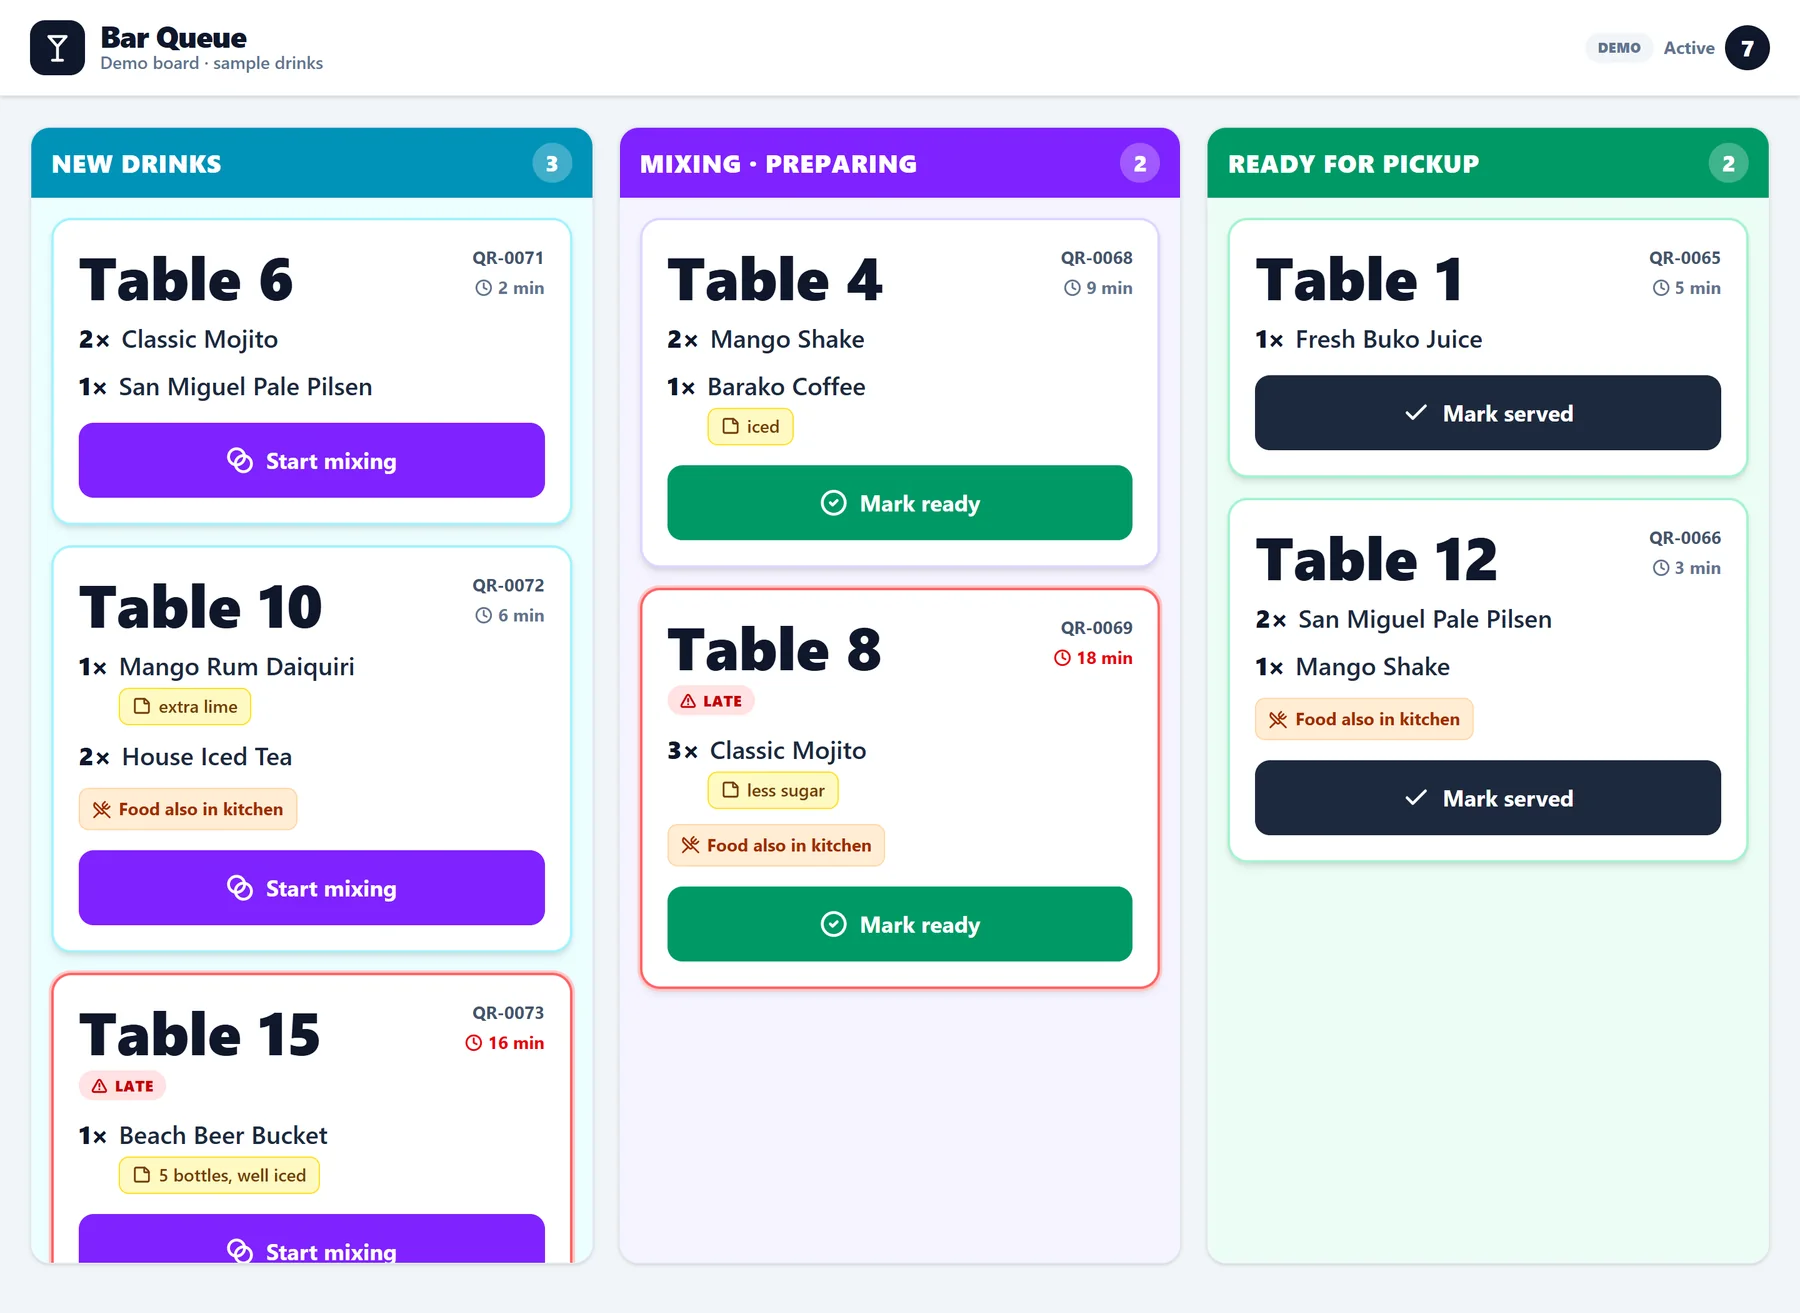
Drinks run on their own board with their own timings — and the ticket says when the same table also has food in the kitchen.
Demonstration board with sample drink orders, labelled DEMO in the product itself.
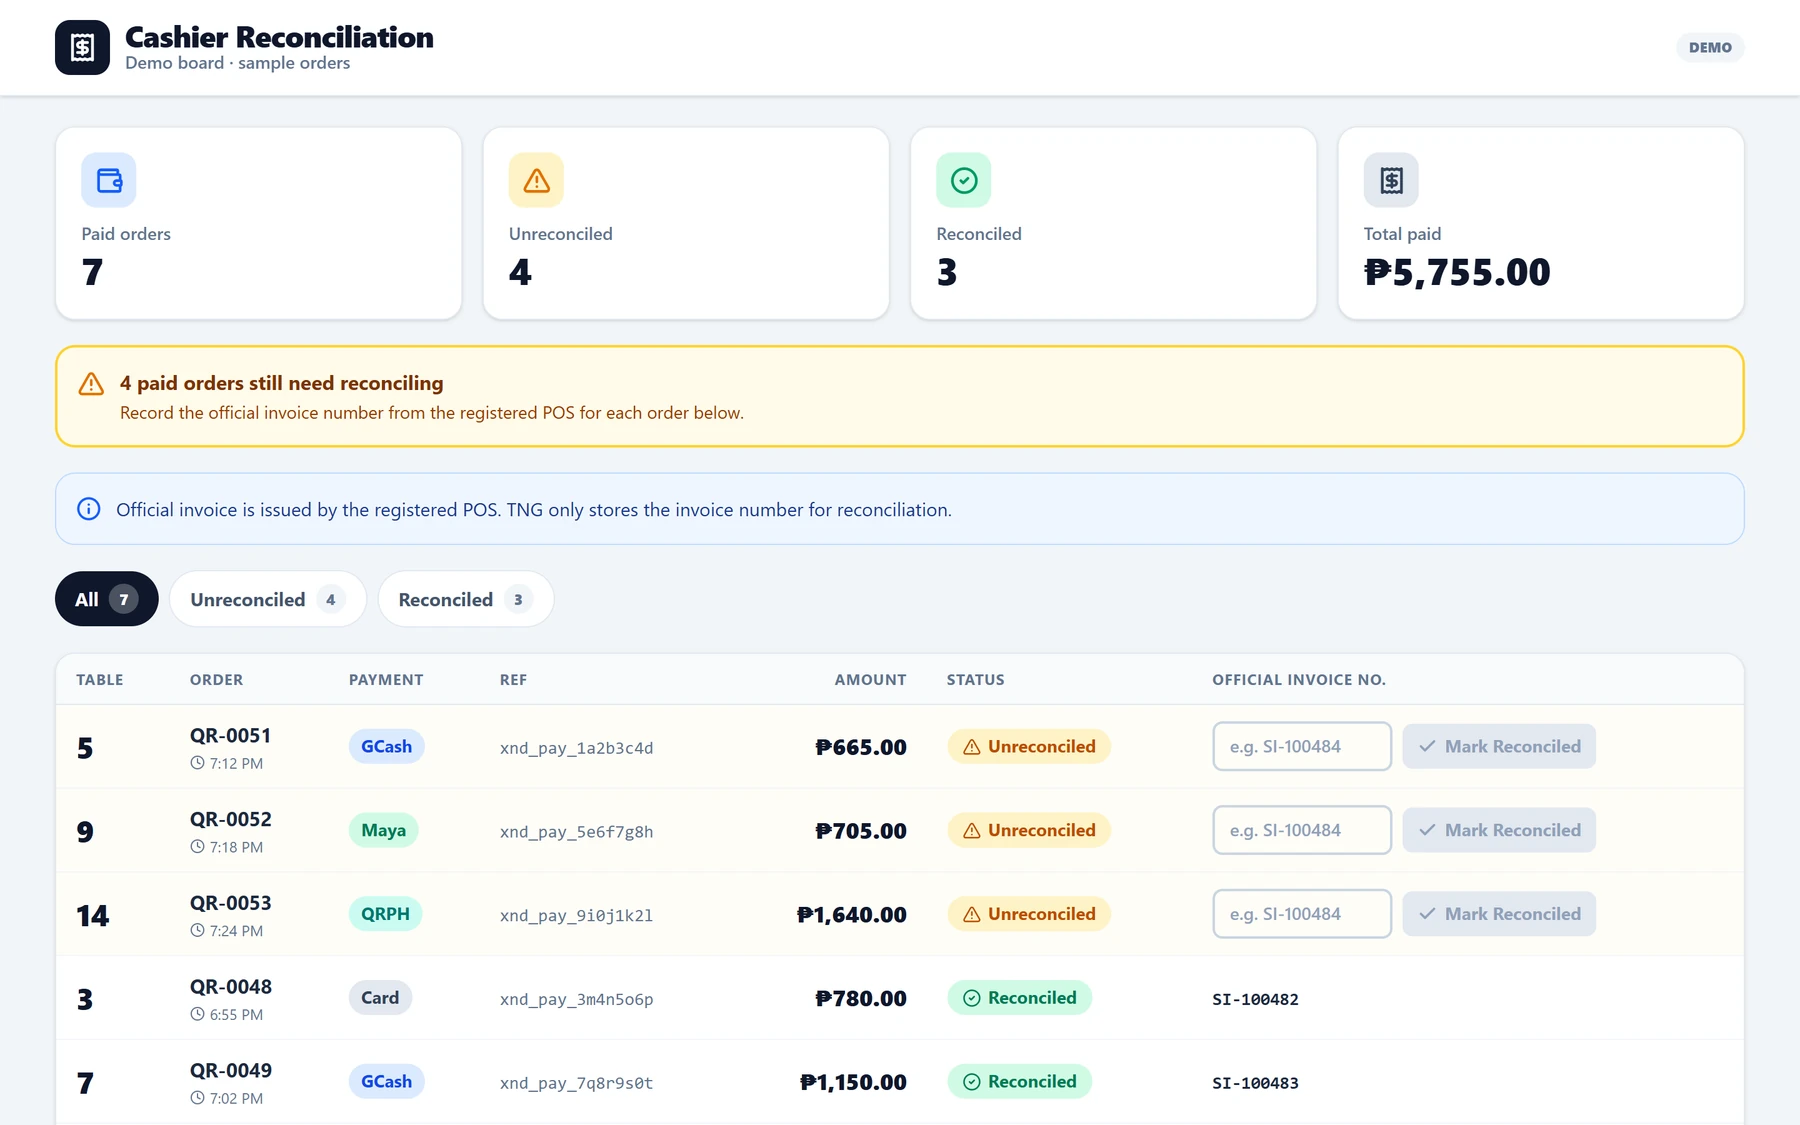
Paid against reconciled, order by order — with the official invoice number recorded against each one.
Demonstration board with sample orders and mock payment references, labelled DEMO in the product.
Read more about the underlying capability: Entertainment & Venues
Aquaculture management
A monitoring and alerting layer for pond-based production: readings per pond, trends over time, and threshold breaches raised as incidents.
The operational problem
Pond conditions change faster than a person can walk the site, and a dissolved-oxygen problem discovered late is a stock loss rather than an adjustment.
What the system does
- Five ponds monitored side by side — dissolved oxygen, temperature, pH, water level, aeration and mains power, each with its own trend.
- A single-pond deep dive showing every monitored reading beside a 24-hour chart.
- Threshold breaches and stale-sensor warnings raised, timestamped and resolved as an operational response layer above the readings.
How to read this evidence This is a prototype running on a simulator. Every reading and every alert shown was generated by simulated data, not measured from a real pond — the product labels this on screen, and no deployment on a working farm is claimed.
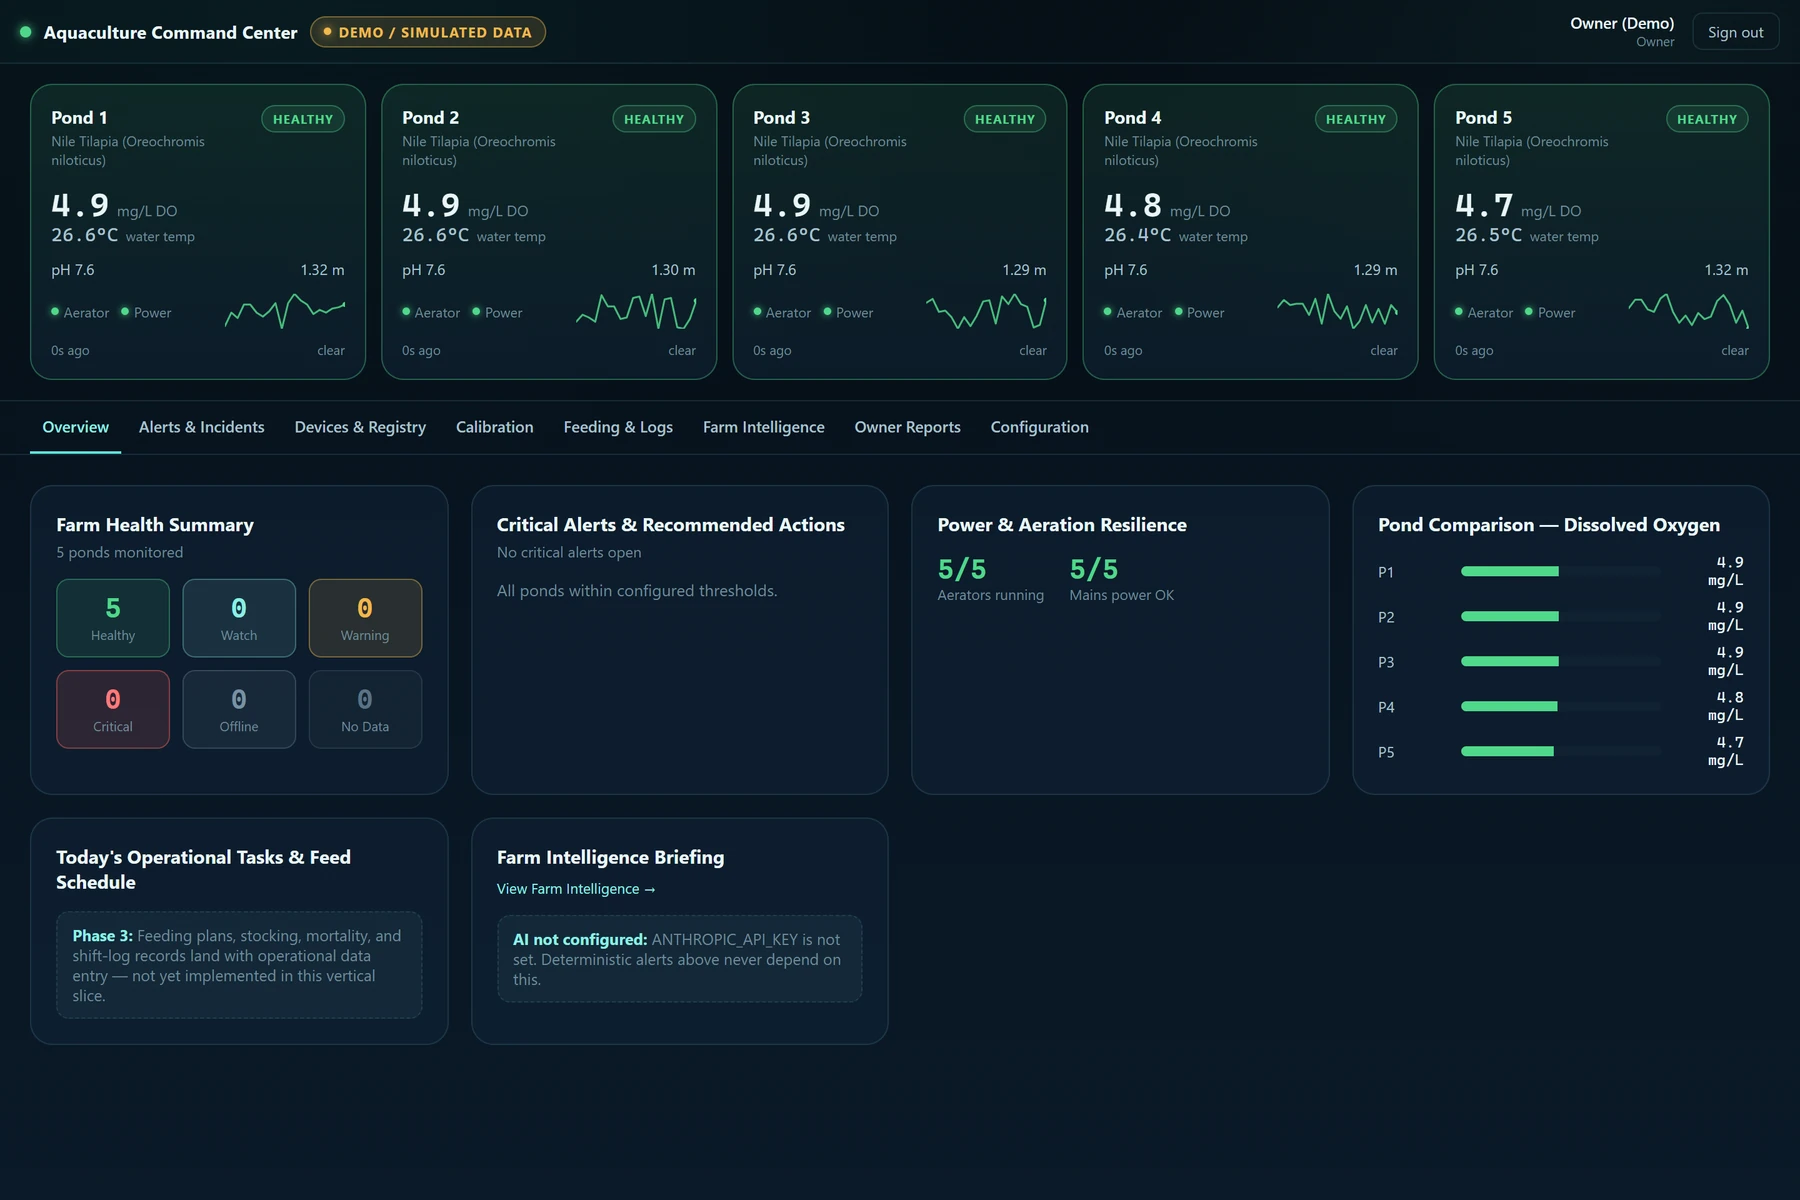
Five ponds monitored side by side — dissolved oxygen, temperature, pH, aeration and mains power, each with its own trend.
Prototype running on the simulator. Every reading shown is simulated, not measured from a real pond — the product labels this on screen.
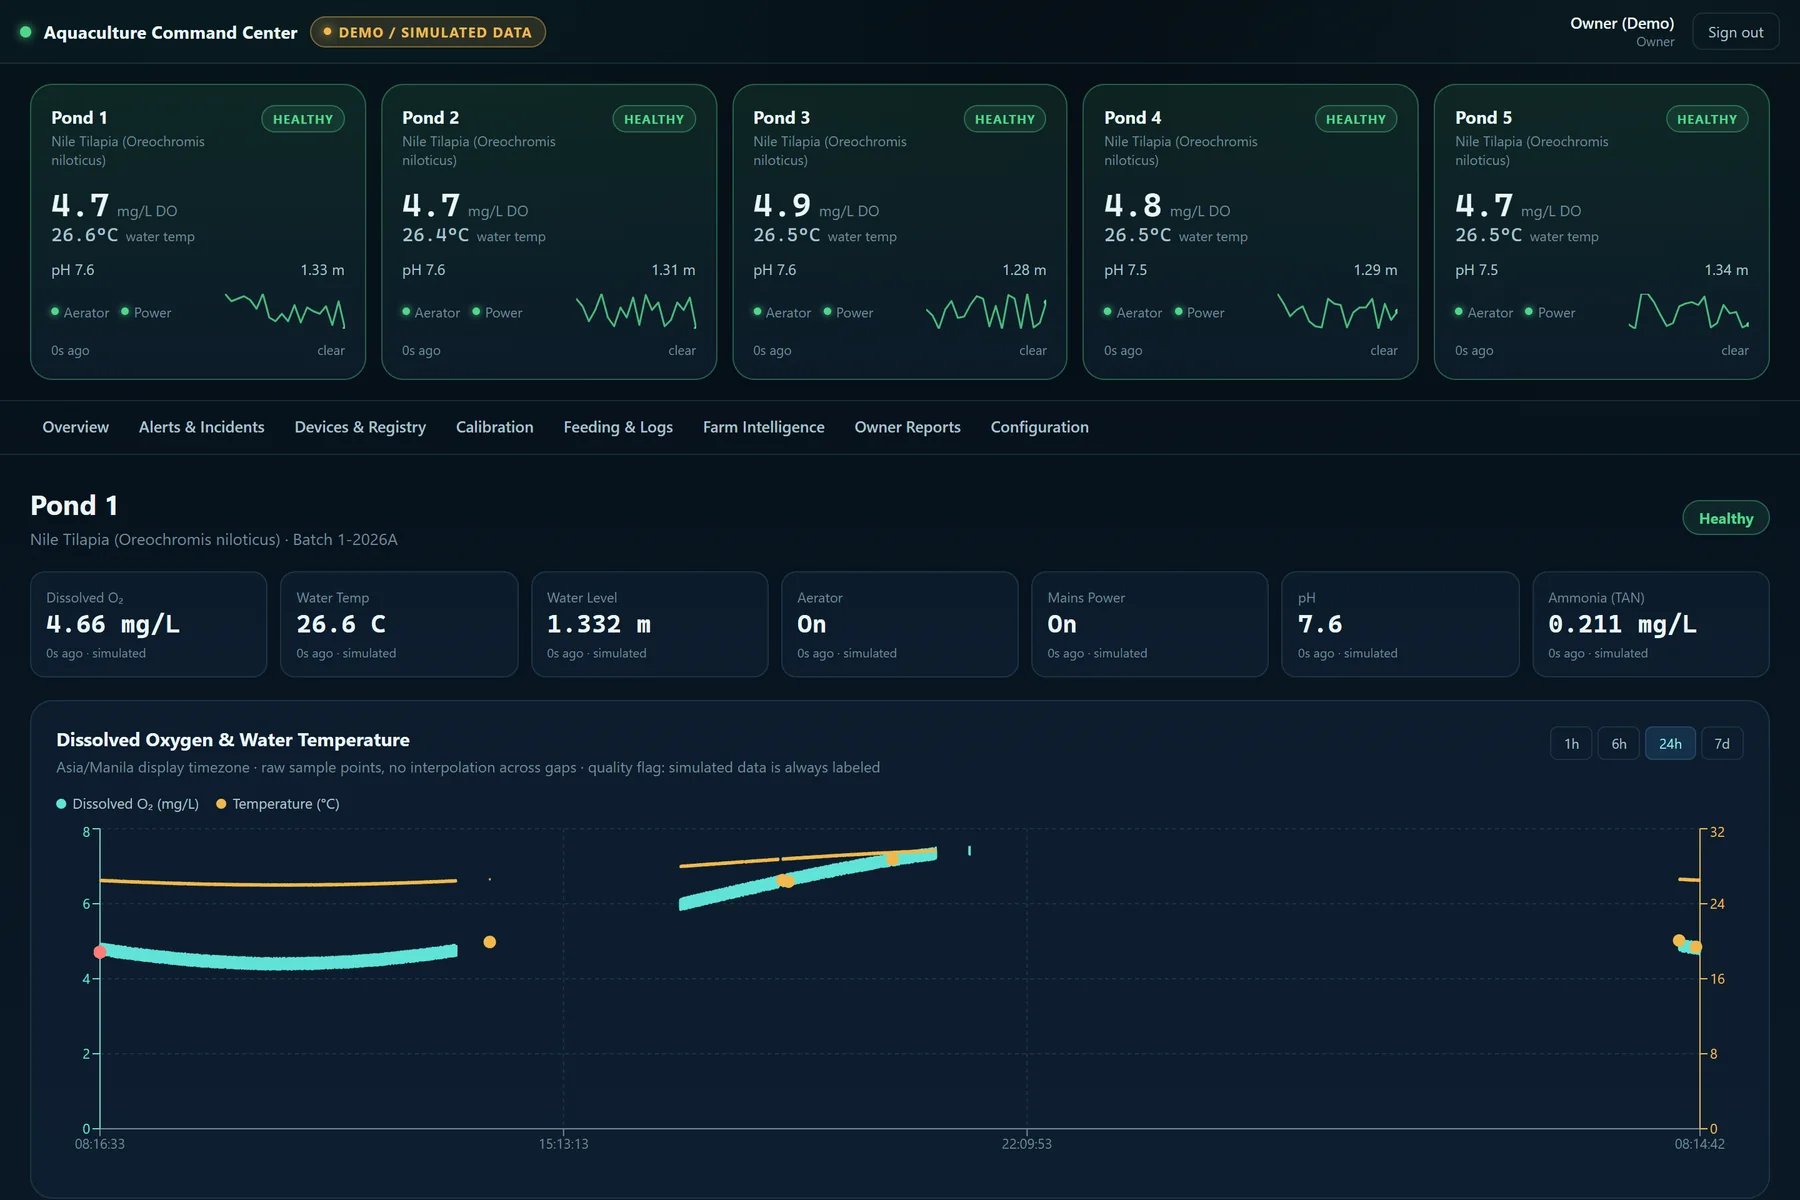
One pond in full: every monitored reading beside a 24-hour trend, with each value labelled as simulated on screen.
Prototype running on the simulator. Every reading shown is simulated, not measured from a real pond — the product labels each value 'simulated' on screen.
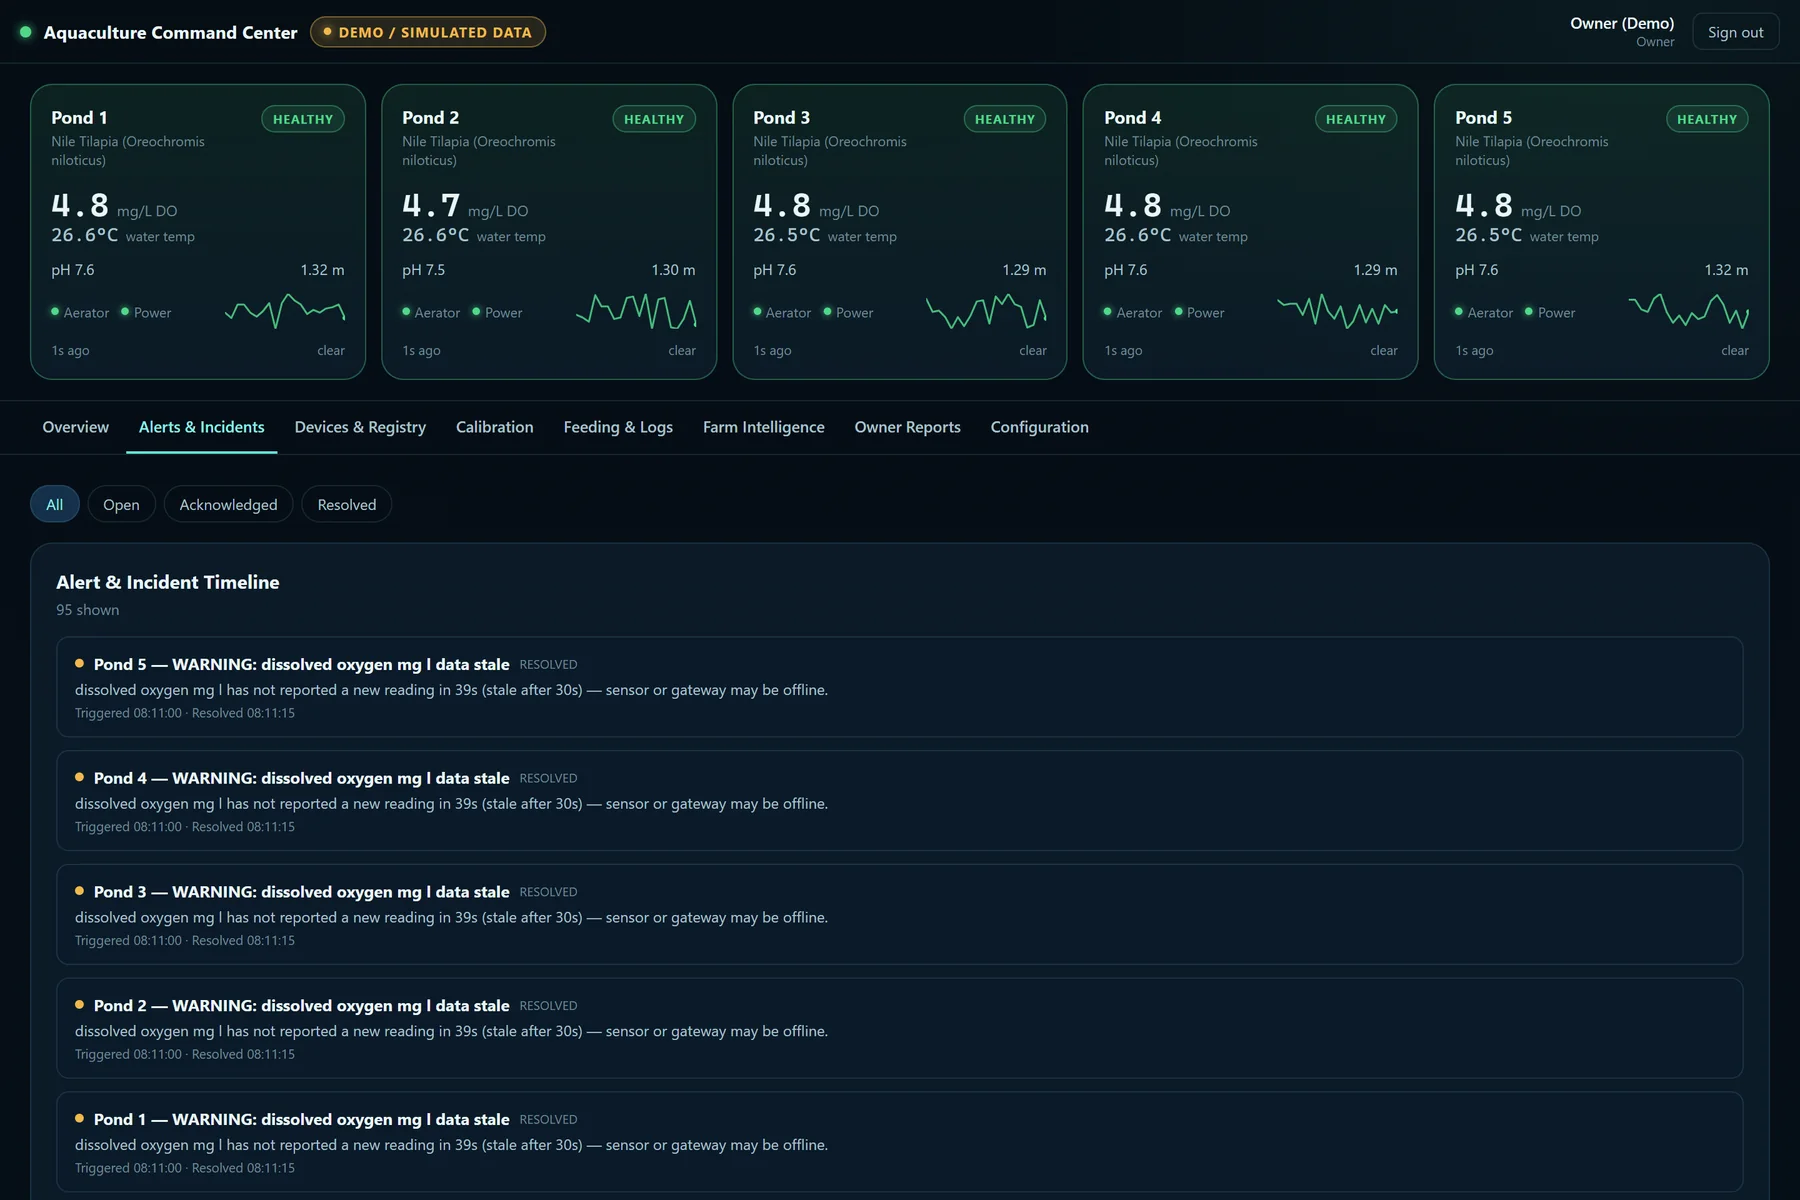
Threshold breaches and stale-sensor warnings raised, timestamped and resolved — the operational response layer above the readings.
Prototype running on the simulator. The alerts shown were raised by simulated readings, not by a real pond — the product labels this on screen.
Read more about the underlying capability: Agriculture & Production
AI Vision
An early recorder shell for turning existing camera environments into counting and zone awareness — with no live streams connected.
The operational problem
Cameras in most operations record for later review, which means nobody sees a queue building, a zone going unattended or a count being missed until after it has cost something.
What the system does
- Zones configured against a defined operational purpose, rather than open-ended surveillance of a whole site.
- The recorder shell with playback timeline, storage, integrations and export.
How to read this evidence A prototype on synthetic test data, captured with both zones offline and awaiting a stream. The zone names are the synthetic run's own generic labels, not a real venue's configuration, and no live footage has been connected. This is not facial recognition.
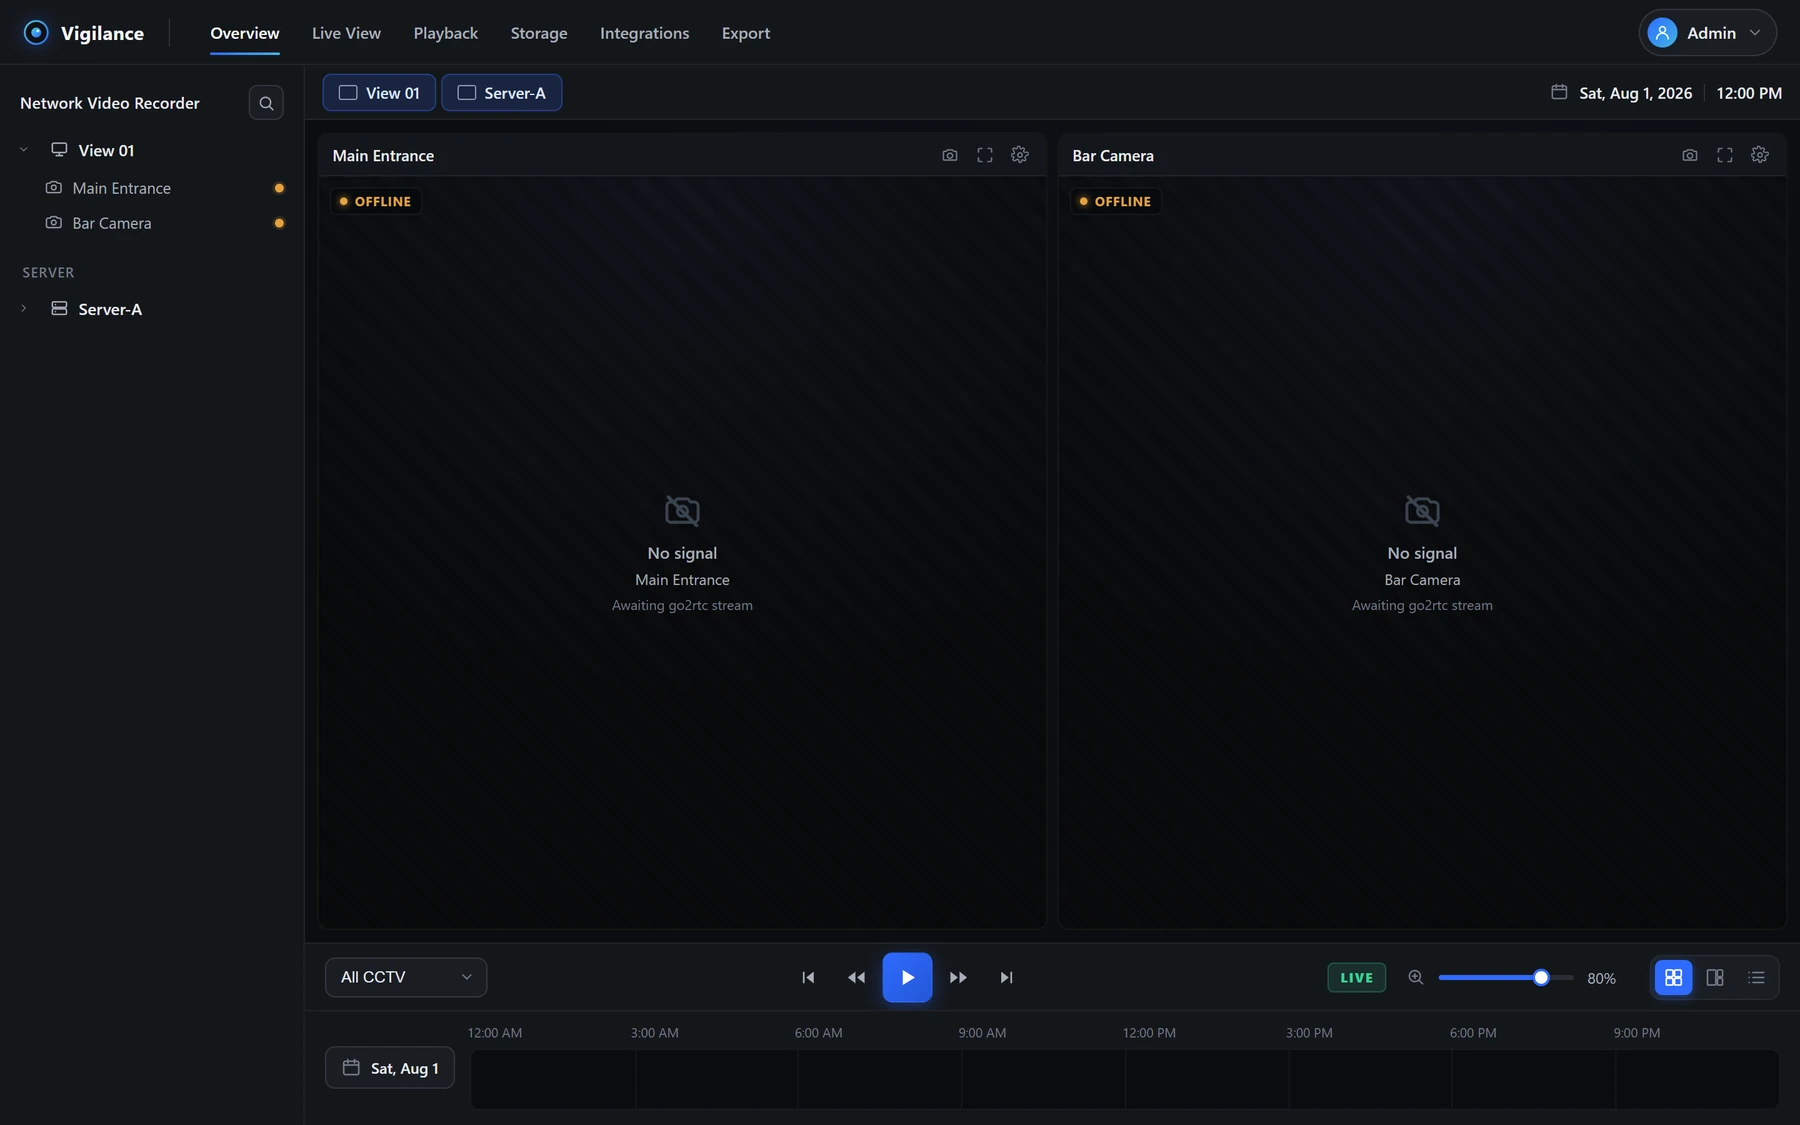
The prototype recorder shell with two zones configured — camera streams were not connected at capture.
Prototype on synthetic test data. Zone names are the synthetic run's own generic labels, not a real venue's camera configuration. No live footage has been connected.
Read more about the underlying capability: Elion Vision
The next step
Start with a Systems Assessment.
A focused conversation about how your operation runs today, where it loses time, and what a connected system would change. No obligation to build anything.
In an assessment we
- Understand how your operation runs today
- Identify the disconnected systems and bottlenecks
- Map the highest-value improvements
- Decide together whether Elion is the right fit